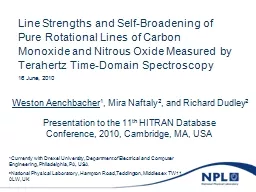
Monoxide and Nitrous Oxide Measured by Terahertz TimeDomain Spectroscopy Presentation to the 11 th HITRAN Database Conference 2010 Cambridge MA USA 16 June 2010 Weston Aenchbacher 1 Mira Naftaly ID: 776407
Download Presentation The PPT/PDF document " Line Strengths and Self-Broadening of P..." is the property of its rightful owner. Permission is granted to download and print the materials on this web site for personal, non-commercial use only, and to display it on your personal computer provided you do not modify the materials and that you retain all copyright notices contained in the materials. By downloading content from our website, you accept the terms of this agreement.
Slide1
Line Strengths and Self-Broadening of Pure Rotational Lines of CarbonMonoxide and Nitrous Oxide Measured by Terahertz Time-Domain Spectroscopy
Presentation to the 11th HITRAN Database Conference, 2010, Cambridge, MA, USA
16 June, 2010
Weston Aenchbacher
1, Mira Naftaly2, and Richard Dudley2
1
Currently with Drexel University, Department of Electrical and Computer Engineering, Philadelphia, PA, USA
2
National Physical Laboratory, Hampton
Road,Teddington
, Middlesex TW11 0LW, UK
Slide2Wednesday, 16 June 2010
2
Introduction
NPL terahertz time-domain spectrometer (THz-TDS)
CO Measurements and Results
Pure rotational lines from
J’
= 3 ← 2 to
J’
= 22 ← 21
Pressures of
0.7 – 5.1 bar
N
2
O Measurements and Results
Pure rotational lines from
J’
= 10 ← 9 to
J’
= 53 ← 52
Pressures of
0.7 – 1.2 bar
Slide3Wednesday, 16 June 2010
3
NPL Terahertz Time-Domain Spectrometer
biased photoconductive emitter
ZnTe refractive index proportional to THz E-field → rotates probe polarization
Ti-sapphire laser
mode-locked
800 nm centre
wavelength
20
fs pulse length77 MHz repetition rate
THz emitter
biased
GaAs
probe beam
pump beam
Wollaston
prism
ZnTe
electro-optic
crystal
Slide4Wednesday, 16 June 2010
4
NPL Terahertz Time-Domain Spectrometer
Slide5Wednesday, 16 June 2010
5
Time-Domain Measurement
probe pulse
THz pulse 20
ps
Probe pulse 2
fs
→
~delta function
Slide6Wednesday, 16 June 2010
6
THz Spectrum
E-field in time
Spectrum
FFT
GHz
Slide7Sample CO Spectrum
(a)
(b)
(c)
Lorentzian
line shape assumed
CO absorption spectrum at 2 bar
Section of sample fit at 2 bar
Expanded section of fit at 2 bar
Slide8Wednesday, 16 June 2010
8
Line Center with Pressure, J’ = 9 line
J’
= 9 center frequency (minus HITRAN) vs. pressure
error bars → standard deviation
Slide9Wednesday, 16 June 2010
9
Sample Measurements, J’ = 9 line
γ
self
= slope
fit amplitude vs. pressure
fit
linewidth
vs. pressure
y error bars → standard deviation
x error bars → pressure uncertainty
Slide10Wednesday, 16 June 2010
10
CO Line Center Frequencies
peak frequency (minus HITRAN) for
J’
Peak frequencies are taken as average over all pressure measurements.
Slide11Wednesday, 16 June 2010
11
CO Results
Line Intensity for J’
Self-Broadening coefficient for J’
Tabulated data can be found:
W.
Aenchbacher
, M.
Naftaly
, and R. Dudley, “Line strengths and self-broadening of pure rotational lines of carbon monoxide measured by terahertz time-domain spectroscopy,” Applied Optics 43/13, pp. 2490, 2010.
error bars → standard deviation
Slide12Wednesday, 16 June 2010
12
Sample N2O Absorption Spectrum
(left) absorption spectrum at 1.2 bar
(right) section of sample fit at 1.2 bar
Slide13Wednesday, 16 June 2010
13
N
2
O Sample Measurements, J’ = 29 line
(top) absorption fit amplitude vs. pressure
(bottom) fit
linewidth
vs. pressure
vertical 95% confidence bars, horizontal pressure uncertainty
zero point included to decrease fit uncertainty
Slide14Wednesday, 16 June 2010
14
error bars → 95% confidence interval
center frequency (minus HITRAN) for
J”
N
2
O
Line Center Frequencies
Slide15Wednesday, 16 June 2010
15
N
2
O Parameters Calculated
Parameter
This work
From literature
B
From line frequencies & Eq. 112.53 ± 0.08 GHz 0.418 ± 0.03 cm-10.419 cm-1 a,bFrom line intensities & Eq. 212.3 ± 0.2 GHz0.410 ± 0.008 cm-1Electric dipole moment 0–0.155±0.003 D-0.161 D b,c
Eqn. 1
Eqn. 2
E.D
.
Palik
, K.N.
Rao
, “Pure rotational spectra of CO, NO, and N
2
O between 100 and 600 microns”,
J. Chem. Phys.,
25
/6 (1956) 1174-1176
.
F.
Rohart
, J.-M.
Colmont
, G.
Wlodarczak
, J.-P.
Bouanich
, “N
2
- and O
2
-broadening coefficients and profiles for millimeter lines of
14
N
2
O”,
J. Mol.
Spectr
.,
222
(2003) 159-171
.
L. Nguyen, J.
Buldyreva
, J.-M.
Colmont
, F.
Rohart
, G.
Wlodarczak
, E.A. Alekseev, “Detailed
provile
analysis of millimeter 502 and 602 GHz N
2
O-N
2
(O
2
) lines at room temperature for
collisional
linewidth
determination”,
Mol. Phys.,
104
(2006) 2701-2710.
Slide16Wednesday, 16 June 2010
16
N
2
O Results
line intensity vs.
J”
self-broadening coefficient vs.
J”
Tabulated data available soon:
W.
Aenchbacher
, M.
Naftaly
, and R. Dudley, “Line strengths and self-broadening of pure rotational lines of nitrous oxide measured by terahertz time-domain spectroscopy,” JOSA B. (submitted May 2010).
error bars → 95% confidence interval
Slide17Wednesday, 16 June 2010
17
Conclusion
THz TDS demonstrated as a viable tool for measurement of molecular spectra.
Contribution to knowledge base of CO molecule
Measured intensity and self-broadening with THz-TDS for the
first time
Contribution to knowledge base of N2O molecule
Measurements to fill gaps in available experimental data for intensity and self-broadening
Slide18Wednesday, 16 June 2010
18
Thank You
For more information: W. Aenchbacher, M. Naftaly, and R. Dudley, “Line strengths and self-broadening of pure rotational lines of carbon monoxide measured by terahertz time-domain spectroscopy,” Applied Optics 43/13, pp. 2490, 2010. W. Aenchbacher, M. Naftaly, and R. Dudley, “Line strengths and self-broadening of pure rotational lines of nitrous oxide measured by terahertz time-domain spectroscopy,” JOSA B. (submitted May 2010). Weston Aenchbacher: wla24@drexel.edu Mira Naftaly: mira.naftaly@npl.co.uk
Financial support for this work was provided
by the
National Measurement Office, an
Executive Agency
of the Department for Business,
Innovation, and
Skills. W.
Aenchbacher
was on
the
MSc
, Photonics and Optoelectronic Devices Program of the University of St. Andrews
Slide19Wednesday, 16 June 2010
19
NPL Terahertz Time-Domain Spectrometer
Ti-sapphire laser
mode-locked
800 nm centre wavelength
20
fs
pulse length
77 MHz repetition rate
beam
splitter
probe
beam
pump beam
delay
stage
THz emitter
biased
GaAs
balanced
photodiode
detector
Wollaston
prism
ZnTe
electro-optic
crystal
Gas Cell
THz
beam
parabolic
mirror
parabolic
mirror
parabolic
mirror
parabolic
mirror
biased photoconductive emitter
ZnTe
refractive index proportional to THz E-field (
Pockels
Effect) → rotates probe polarization
Slide20Wednesday, 16 June 2010
20
CO Tabulated Results
W.
Aenchbacher
, M.
Naftaly
, and R. Dudley, “
Line strengths and self-broadening of pure
rotational lines
of carbon monoxide measured by
terahertz time-domain spectroscopy,” Applied Optics 43/13, pp. 2490, 2010.
Slide21Wednesday, 16 June 2010
21
J’←J’’Line intensities (cm-1/molecule.cm-2) x 10-22J’←J’’Line intensities (cm-1/molecule.cm-2) x 10-22MeasuredHITRAN(error not reported) MeasuredHITRAN(error not reported) valueerrorvalueerror10←90.540.080.57032←312.840.182.8511←100.640.080.72733←322.670.112.7312←110.930.150.90134←332.620.132.6113←120.900.081.0935←342.620.162.4714←131.280.101.2936←352.340.112.3315←141.520.081.4937←362.190.112.1816←151.540.111.7038←372.150.112.0317←161.790.101.9139←381.910.111.8718←172.060.122.1140←391.740.111.7219←182.130.132.3041←401.630.081.5720←192.30.082.4842←411.570.091.4321←202.650.172.6443←421.360.081.2922←212.630.122.7844←431.250.081.1623←222.780.152.9045←441.320.071.0324←232.940.152.9946←451.010.080.91625←242.960.203.0647←460.920.080.80926←253.040.143.1048←470.930.080.71027←263.130.123.1249←480.740.080.62028←273.150.213.1150←490.580.080.53929←283.030.133.0751←500.580.080.46630←292.980.133.0252←510.640.080.40031←303.040.172.9453←520.390.080.342
N
2
O
Tabulated Results - Intensities
Slide22Wednesday, 16 June 2010
22
J’←J’’
Self-broadening (GHz/atm)J’←J’’Self-broadening (GHz/atm)MeasuredHITRAN 2% error 5% MeasuredHITRAN 2% error 5%valueerrorvalueerror10←93.10.33.2432←312.70.12.6111←102.70.63.2133←322.50.12.6112←1130.43.1834←332.60.12.5813←122.50.53.1235←342.70.12.5814←133.10.23.0936←352.50.12.5515←142.80.23.0637←362.60.12.5516←152.80.23.0338←372.60.12.5217←162.80.22.3039←382.80.12.5218←1730.22.9740←392.50.12.4919←182.80.22.9441←402.60.12.4920←192.60.12.9142←412.60.12.4921←202.90.22.8843←422.60.12.4622←212.60.12.8544←432.60.32.4623←222.80.12.8245←443.10.32.4324←232.80.22.7946←452.60.42.4325←242.80.12.7847←462.80.52.4326←252.70.12.7648←473.40.32.4027←262.70.12.7349←482.50.22.4028←272.80.12.7050←492.70.42.4029←282.60.12.6751←502.70.52.3730←292.70.12.6752←513.41.12.3731←302.80.12.6453←522.30.42.37
N
2
O
Tabulated Results – Self-Broadening
Slide23Carbon Monoxide
Slide24Line Parameters
where
L.S. Rothman, et al: The HITRAN molecular spectroscopic database and HAWKS (HITRAN atmospheric workstation): 1996 Edition,
J. Quant.
Spectrosc
.
Radiat
. Transfer Vol.
60/5
, 1999, pp 665-710.
Slide25Measuring Line Parameters
Assume each line is a
Lorentzian
:
and assuming an ideal gas:
obtain
A
(
P
) by
Lorentzian
fits at various pressures