PDF-Performance EvaluationConfusion Matrix:
1
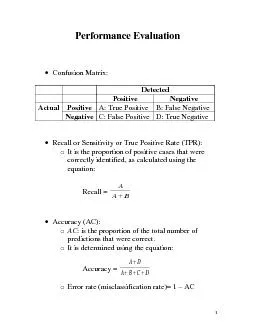
Positive Negative
Actual
Positive
A True Positive
Negative
Negative
C False Positive
D True Negative
BAA Accuracy AC is the proportion of the total number ofpredictions
Download Presentation
"Performance EvaluationConfusion Matrix:" is the property of its rightful owner. Permission is granted to download and print materials on this website for personal, non-commercial use only, provided you retain all copyright notices. By downloading content from our website, you accept the terms of this agreement.
Presentation Transcript
Transcript not available.