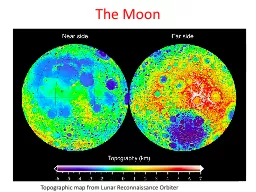
/
Physics of Volatiles on the Moon Physics of Volatiles on the Moon

Physics of Volatiles on the Moon - PowerPoint Presentation

lindy-dunigan
lindy-dunigan . @lindy-dunigan
Follow
378 views
Uploaded On 2017-01-27

Physics of Volatiles on the Moon - PPT Presentation

Oded Aharonson 12 1 Weizmann Institute of Science 2 California Institute of Technology With contributions from N Schorghofer P Hayne Comets Asteroids IDPs Solar Wind Moon Giant ID: 514641

ice water h2o lunar water ice lunar h2o moon temperature radar surface lcross areas hydrogen polar thermal molecules cold

Share:

Link:

Embed:

Download Presentation from below link

Download Presentation The PPT/PDF document "Physics of Volatiles on the Moon" is the property of its rightful owner. Permission is granted to download and print the materials on this web site for personal, non-commercial use only, and to display it on your personal computer provided you do not modify the materials and that you retain all copyright notices contained in the materials. By downloading content from our website, you accept the terms of this agreement.


Presentation Transcript

Slide1

Physics of Volatiles on the Moon

Oded Aharonson

1,2

1

Weizmann

Institute of

Science

2

California Institute of Technology

With contributions from N. Schorghofer / P. HayneSlide2

Comets

Asteroids

IDPs

Solar

Wind

Moon

Giant

Molecular

CloudsSlide3

Water Delivery to the Moon

Water delivery over

the age of the Solar System, before any loss processes take place

(from Moses et al., 1999)

Source

Amount

Delivered to Surface

Interplanetary Dust Particles 3 to 60 x 1013

kgMeteoroids and Asteroids 0.4 to 20 x 10

13 kgJupiter-family Comets 0.1 to 200 x 10

13 kgHalley-type Comets 0.2 to 200 x 10

13 kgMain

Belt Comets ?

(potentially very large

)Slide4

In the past, obliquity was higher after transition between two Cassini states. The

permanently

shaded areas have not seen the sun for ~2 billion years.

Lunar Orbit

Low obliquity (axis tilt) of Moon leads to permanent shadow in craters at high latitude.Slide5

Mazarico et

al. (2011)

Clementine

photos

taken

over 1

lunar

daySlide6

Cold TrappingSublimation rates highly non-linear with temperature

Loss from sunlit areas extremely fast; shadowed areas, extremely slowSlide7

Inefficiency of Jeans Escape

Water strongly bound to the Moon by gravity, < 10

-6

molecules escape per hop

Maxwell-Boltzmann velocity distribution:

Gravitational escapeSlide8

Ice Sublimation and Lag FormationIce table moves downward as ice sublimates and diffuses through desiccated regolith layer

Quasi

-steady state can result if sources balance sinks, or if sublimation

slow

Depth

of ice table depends on insolation, regolith composition and porosity

IR emission to space

H

2

O (

g

)

solar

conductionSlide9

Stability of Buried Ice

Schorghofer, 2008Slide10

Of Snowlines

Conventional Snowline:

Condensation temperature of H

2

O in

protoplanetary

disk (145–170K)

“Buried Snowline”:

Below a mean surface temperature of about 145K, water ice will remain within the top few meters of the surface over the age of the solar system. A variation of ±10K (135–155K) captures a large range of soil layer properties.

Neither conventional nor buried snowline corresponds to an exact temperature. Also note, that

buried T < conventional T

.Slide11

Terminology

Adsorbed water

: Binding between water and another substance

Physisorption

(= physical adsorption), weakly bound, van der Waals forces

Chemisorption

(= chemical adsorption), strongly bound, covalent bonding, can be dissociative

i.e.

breaks molecule apart

Hydration

(water added to crystal structure)

IceCrystalline, all the ice you have ever seen is in this form

Amorphous, forms only at low temperature (<~140K)Slide12

Classic Picture

Energy is partitioned between thermal (kinetic) energy and gravitational (potential) energy;

H is the height of a typical bounce of a single molecule:

½mv

z

2

= ½kT =

mgH

H =

kT

/(2mg) ≈ 50 km

g = surface acceleration (1.62 m/s

2)

Ballistic flights are typically ~300 km long and last ~1 minuteMolecules move on the day side, stop on the night side.

Watson-Murray-Brown (

1961)Slide13

Lunar Water Cycle

David Everett--LRO Overview

13Slide14

No Hopping due to Chemisorption?Slide15

Incoming water molecules are trapped in surface defects

Some are released thermally, others

super-thermally

by Lyman-

α

Some

super-thermal

molecules are slowed down by diffusion between

grains

Hopping with thermal and

super-thermal speeds

Non-thermal

(Ly α)

Lunar Surface

?Slide16

Monte Carlo Model: Spread of initial source

t=

0

t=1 month

t=24 hours

H

2

O molecules launched in random direction, with

Maxwellian

velocity components

Destruction

rate 0.4%/hop

lifetime 10

5

s

Residence time is calculated from T and

θScheduling algorithm (event-driven code), processed in time order

Temperature model, 1-D

at every longitude-latitude point, time step 1 hour

Follows past models

(e.g. Butler

1997, ...

)

Initially

: 1

kmol

of

H

2

O

Average

of 100 hops until

cold trappingSlide17

Dusk-Dawn Asymmetry

More molecules at morning terminator than at evening terminator

diurnal H

2

O variations would be asymmetric, contrary to observations

Such an asymmetry is known for other volatiles:

20

Ne,

40

Ar

(Hodges et al. 1973)

Continuous production of H

2

O molecules at noon (by recombination of OH

(Orlando et al. 2012))Slide18

Ceres, Transport Effeciency

Fraction of

initially 18t of ice

that ends up at cold traps covering 0.5% of the surface area

Like the Moon and Mercury, Ceres is able to concentrate H

2

O molecules globally into cold traps, if

coldtraps

exist.

Transport Efficiency

The Moon

16%

Mercury

17%

Ceres

13%Slide19
Slide20

Paige et al. (2010)

Mean annual temperatureSlide21

Paige et al. (2010)Slide22

Obliquity EffectsSiegler et al. (2011) showed polar volatiles must be younger than the Cassini state transition (precise timing unknown), when Moon’s obliquity reached nearly 90

unstable

timeSlide23

Mean Annual Temperature (Obliquity)

Present day: 1.5

4

8

12

Siegler et al. (2011)Slide24

OBSERVATIONS:Neutrons, Radars, and Impact

Neutron Spectroscopy (Lunar Prospector & LRO)

Earth-based

radar

Bistatic radar experiment by Clementine

MiniSAR

(radar on LRO)

LCROSS ImpactSlide25

David Everett--LRO Overview

Polar Topography from Radar

(Margot et al., 1999)

Earth-Based RADAR topography maps of the lunar polar regions. White areas are permanent shadows observable from Earth. Grey areas are permanent shadows that are not observable from Earth.

North Pole

South PoleSlide26

David Everett--LRO Overview

26

Lunar Prospector Neutron Spectrometer maps show small enhancements in hydrogen abundance in both polar regions

(Maurice et al, 2004)

The weak neutron signal implies a the presence of small quantities of near-surface hydrogen mixed with soil, or the presence of abundant deep hydrogen at > 1 meter depths;

1.5±0.8% H2O-equivalent hydrogen by weight

(Feldman et al. 2000, Lawrence et al. 2006)

Slide27
Slide28

David Everett--LRO Overview

28

The locations of polar hydrogen enhancements are associated with the locations of suspected cold traps

Not all suspected cold traps are associated with enhanced hydrogen

Aside from permanent shade, the most important parameter for lunar ice stability is the flux of indirect solar radiation and direct thermal radiation

North Pole

South Pole

Cabeus

U1

ShackeltonSlide29
Slide30

No radar evidence for the MoonSlide31

Mini-SAR map of the Circular Polarization Ratio (CPR) of the

North Pole.

Fresh

,

“normal”

craters

(red circles

)

: high CPR

inside and outside their rims

.

The

“anomalous” craters (green circles) have high CPR within, but not outside their rims. Their interiors are also in permanent sun shadow. These relations are consistent with the high CPR in this case being caused by water ice. Slide32

The LCROSS Mission32

LCROSS Shepherding Spacecraft (

SSc

) equipped with a suite of remote sensing instruments, including UV/VIS and NIR spectrometersSlide33

LCROSS Impact

(Lunar Crater Observation and Sensing Satellite)

Artifical impact in permanently shaded area (Cabeus crater); spectral observation of ejecta; Oct 9, 2009

5.6±2.9% H

2

O by mass

(Colaprete et al., 2010)

Also found (in order of abundance): H

2

S, NH

3

, SO

2, CH3OH, C2H4, CO2, CH

3OH, CH4, OHSlide34

LCROSS ResultsWater ice ~6% (3%) abundance by mass

Many other volatiles:

Ca

, Mg, Na

Also mercury (don’t drink the water!), and silver (Ag,

)Slide35

LCROSS ResultsMajority of observed volatiles predicted by theory along with Diviner temperature measurements

Some surprises:

Methane (CH

4

), carbon monoxide (CO),

Molecular hydrogen (H

2), from LAMP,


?Slide36

Summary of Polar H2O Observations

Excess of 1.5±0.8% H2O-equivalent hydrogen by weight

(Feldman et al.

200

0)

- Lunar Prospector Neutron

Spectrometer

Several % H2O confirmed by LEND

(

Mitrofanov

et al, 2010)

Bistatic radar experiment by Clementine also suggested the presence of water ice

(Nozette et al., 1996).Radar evidence for ice on both poles of Mercury; none on the Moon (thus <<100%)LCROSS Impact: 5.6±2.9% H2O by mass (Colaprete et al., 2010)

Evidence from MiniSAR Slide37

ADSORBED H2O AND OH

Observed spectroscopically by three spacecraft

M3 (Moon Minearalogy Mapper Spectrometer) on Chandrayaan-1

(Pieters et al., 2009)

EPOXI flyby

(Sunshine et al., 2009)

Cassini flyby

(Clark 2009)

H

2

O = Water

OH = Hydroxyl

(Has also been suggested a long time ago.)Slide38

Scaled reflectance spectra for M3 image strip

(A) The strongest detected 3-μm feature (~10%) occurs at cool, high latitudes, and the measured strength gradually decreases to zero toward mid-latitudes. At lower latitudes (18°), the additional thermal emission component becomes evident at wavelengths above ~2200 nm. (B) Model near-infrared reflectance spectra of H2O and OH. These spectra are highly dependent on physical state. The shaded area extends beyond the spectral range of M3.

(Pieters et al., 2009)Slide39

Map of Water and Hydroxyl from M3

Red = 2-micron pyroxene absorption band

depth

Green

= 2.4-micron apparent

reflectance

Blue

= absorptions due to water and hydroxyl

.

(

Clark et al., 2010)Slide40

Summary

Volatiles hop along ballistic trajectories, and H

2

O may be able to survive in cold (<110K) permanently shaded areas near the lunar

poles

Significant observational evidence for ice in permanently shaded areas near both poles of the Moon; ~ several weight

percent

Hydroxyl and water, probably adsorbed, in polar

latitudes, but—

Water mobile on a timescale of a lunar day is difficult to reconcile with theory/observationsSlide41
Slide42

Mazarico (pers. comm.)Slide43

Mazarico (pers. comm.)Slide44
Slide45

Desorption Experiments

Fe-rich lunar analog glass

JSC-1A

albite (feldspar)

Hibbitts et al. (2011):

glass is hydrophobic;

other materials can chemisorb even at high temperaturesSlide46

Paul G. LuceySlide47

47

Diviner Spectral Channels:

2 solar channels: 0.35 – 2.8

m

m

7 infrared channels:

7.80

m

m

8.25

m

m 8.55

mm 13-23 m

m 25-41 mm

50-100 mm 100-400

m

m

Diviner typically operates in “push-broom” mode

Diviner’s independent two-axis actuators allow targeting independent of the spacecraft

~ 4 km footprintSlide48

Adsorption Isotherm

15°C, lunar sample

approximately reversible

adsorption rate = desorption rateSlide49

Adsorption Isotherm  Desorption Rate

Sublimation rate of ice into vacuum:

Desorption rate of adsorbed water:

P

0

... saturation vapor pressure of ice

P

0

(T)

m

... mass of molecule

k

... Boltzmann constant

T

... temperature

θ ...

adsorbate coverage