/
Quadrats Quadrats

Quadrats - PowerPoint Presentation

lindy-dunigan
lindy-dunigan . @lindy-dunigan
Follow
367 views
Uploaded On 2017-05-01

Quadrats - PPT Presentation

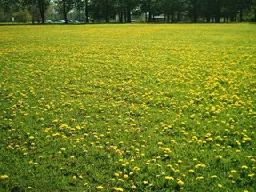
Square sample areas marked out with a frame Repeatedly place a quadrat at random positions in a habitat Record number of organisms present each time Quadrats Random numbers generated to create coordinates where the quadrat is placed in an area reduces bias ID: 543687

number daisies squared total daisies number total squared chi 100 test critical region species heather estimate field moss quadrats

Share:

Link:

Embed:

Download Presentation from below link

Download Presentation The PPT/PDF document "Quadrats" is the property of its rightful owner. Permission is granted to download and print the materials on this web site for personal, non-commercial use only, and to display it on your personal computer provided you do not modify the materials and that you retain all copyright notices contained in the materials. By downloading content from our website, you accept the terms of this agreement.


Presentation Transcript

Slide1
Slide2
Slide3

Quadrats

Square sample areas marked out with a frame.

Repeatedly place a quadrat at random positions in a habitat

Record number of organisms present each timeSlide4

Quadrats

Random numbers generated to create coordinates where the quadrat is placed in an area (reduces bias)Slide5

There are two main kinds of data that we can gather for the daisies in

a

field:

Qual

itative: ‘there are

lots of

daisies in the field’

Quant

itative: ‘there are 5087 daisies in the field’

Counting daisiesSlide6

How many daisies in the field?

You have 15 seconds…Slide7

How did you estimate the number of daisies?

Did you try to count them all?

Or did you use another method?

We need a

quantitative

estimate for the number of daisies – it doesn’t have to be perfect but it should be as close as possible to the real number.

Write your first estimate down, then try again, seeing if this will help…

How many did you count?Slide8
Slide9

How did you use the grid to estimate the number of daisies? Did it help?

There are 78 daisies

If you were asked to count the number of daisies in the school field, it would be impractical to count each one.

How could you use the grid method to get an accurate, reproducible estimate?

Use the following steps:

Select at least three quadrats and count how many daisies are in each

(

eg

4, 8, 3)

Then find the mean number per quadrat

(4 + 8 + 3 = 15. 15/3 = 5 daisies per quadrat)

Multiply the mean by the number of quadrats that would fit into the field to get your estimated total number of daisies. (5 x 20 = 100 daisies estimated in the field)Is your estimate the same?Slide10
Slide11

There were 103 daisies in the field.

How close were you?

How many daisies were there? Slide12

They only work for immobile/slow moving populations.

The more data you collect, the more reproducible your result…the more samples the better!

Quadrats should be placed randomly to avoid bias.

Quadrats: Top TipsSlide13

Chi-squared testSlide14

Chi Squared Test (stats test)

Test for an association between the species

If species always are in the same quadrat (positive)

If species are never in the same quadrate (negative)Slide15

Hypotheses

H

0

= null hypothesis = two species are distributed independently (there is no association)

H

1

= two species associated (either positively or negatively)Slide16

My results

Species

Frequency

Heather only

9

Moss Only

7

Both species

57

Neither species

27

Total samples100Slide17

Heather

absent

Heather

present

Total

Moss

absent

27

9

36

Moss present

75764

Total

34

66

100

Start with a contingency tableSlide18

Expected values

Expected =

row total x column total

grand total

Heather

absent

Heather

present

Total

Moss

absent(34x36)/100 = (66x36)/100

=

36

Moss present

(34x64)x100

=

(66x64)/100

=

64

Total

34

66

100Slide19

Expected values

Expected =

row total x column total

grand total

Heather

absent

Heather

present

Total

Moss

absent(34x36)/100 = 12(66x36)/100

= 24

36

Moss present

(34x64)x100

= 22

(66x64)/100

= 42

64

Total

34

66

100Slide20

Degrees of Freedom

(m – 1) x (n – 1)

m

= number of rows

n

= number of columns

(measure of how many values can vary)Slide21

Degrees of Freedom

(m – 1) x (n – 1)

m

= number of rows = 2

n

= number of columns = 2

(2 – 1) x (2 – 1)

= 1 x 1

Degrees of freedom for this test = 1Slide22

Critical region

Find critical region from a table of chi-squared values

How sure you can be about your

results

Significance level of 5% (0.05

) is the maximum to be regarded as significant.Slide23
Slide24

Critical region

Find critical region from a table of chi-squared values

Significance level of 5% (0.05)

For this test = 3.841Slide25

Chi Squared Test

χ

2

=

(O – E)

2

E

(O – E)

2

E

(O – E)

2

E

(O – E)

2

E

(O – E)

2

ESlide26

Chi Squared Test

χ

2

=

(O – E)

2

E

(27

12)

2

12

(7

22)

2

22

(9

24)

2

24

(57

42)

2

42Slide27

Chi Squared value

18.75 + 10.23 + 9.38 + 5.36

Chi squared

value =

43.72

Slide28

Which hypothesis

Chi squared

value =

43.72

Critical region = 3.841

Compare calculated chi squared value to critical region

Higher than critical region = reject null hypothesis (there is an association)

Equal to or lower than critical region = keep null hypothesis (there is no association)Slide29

Since the x

2

value of

43.72

is greater than critical value of 3.841,

the null hypothesis is

rejected

.

Therefore, we can be 95% sure that there is a relationship between the heather and moss.Slide30

In pairs complete the random sampling.

Choose 2 of the plants to see if there is an association.

Do 100 throws and record your results.

Work through the sheet to complete the chi squared stats test.

This

powerpoint

is on my website if you need to refer back to it!

Your turn!