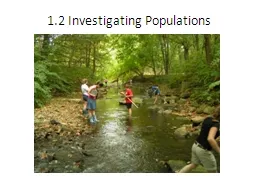
/
1.2 Investigating Populations 1.2 Investigating Populations

1.2 Investigating Populations - PowerPoint Presentation

pamella-moone
pamella-moone . @pamella-moone
Follow
401 views
Uploaded On 2016-05-16

1.2 Investigating Populations - PPT Presentation

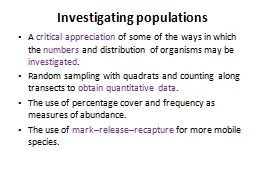
Learning Objectives Recap yesterday Elaborate on a few things Study the different ecological techniques used to study populations Decide on a field trip Studying Habitats When studying a habitat ecologists will first estimate the populations of the species living there ID: 322296

quadrat sampling individuals number sampling quadrat number individuals random size species samples area quadrats time populations habitat animals total

Share:

Link:

Embed:

Download Presentation from below link

Download Presentation The PPT/PDF document "1.2 Investigating Populations" is the property of its rightful owner. Permission is granted to download and print the materials on this web site for personal, non-commercial use only, and to display it on your personal computer provided you do not modify the materials and that you retain all copyright notices contained in the materials. By downloading content from our website, you accept the terms of this agreement.


Presentation Transcript

Slide1

1.2 Investigating PopulationsSlide2

Learning Objectives

Recap yesterday. Elaborate on a few things.

Study the different ecological techniques used to study populations.

Decide on a field trip?Slide3

Studying Habitats

When studying a habitat, ecologists will first estimate the populations of the species living there.

The

abundance

of each species can never be known exactly, but

sampling

can give reasonably accurate estimates.

Why would it be wrong to try to count every individual of a population?

So small samples are studied at

random locations

, and then

scaled up

to fit the entire habitat.

There are of course, a range of ecological techniques at an ecologist’s disposal. Slide4

Introducing Sampling Techniques

The approach to sampling can be in one of two ways:

1. Random

2. Systematic

Random Sampling:

This is usually employed when trying to

eliminate bias

. Two numbered axis can be laid out over the sample area. Generation of random numbers provides co-ordinates for areas to study.Systematic Sampling:A similar grid is laid over the entire area, but samples are taken at regular intervals. Time-consuming... But more reliable?These two approaches are realised using the following apparatus.

Random grid

islandSlide5

Quadrats

A quadrat is just a fancy square used by biologists/ecologists.

There’s two types of quadrat:

Frame Quadrat

Point QuadratSlide6

More About Quadratting

Three things to consider when using quadrats:

The size of the quadrat:

Depends on the size of species being investigated, or what kind of groups or colonies the species live in.

The number of samples being taken in the area:

The more samples you take in the habitat, the more reliable the results will be... Depends if time is an issue.

The position of each quadrat: Producing unbiased results within a small time-frame is the best idea. Random sampling would work well.A problem that arises during quadrat sampling is the clumping of plants. To get around this... We measure the ‘

mean density’ or ‘percentage cover’ instead.Slide7

Mean Density

You count all the individuals of a single species in a quadrat. Do this for a few quadrats (as painstaking as it may be).

The quadrat must be of a known size.

Plug the numbers into the following formula:

Estimated mean

=

Total number of induviduals counted density Number of quadrats x Area of quadratSlide8

Transects

Transect sampling

is more of a

systematic technique

, but can be adapted to a random technique if required.

See transect sheet.Slide9

Mark-Release-RecaptureSlide10

What about animals?

What we’ve seen up until now is fine for sampling plant populations, but

studying animals and insects is trickier

.

A set of animals are

caught

and then

marked in some way.They’re then released back into the community.After a specified length of time, the community is revisited and the same number or individuals is caught again. The number of marked individuals is counted.The population size is calculated:

Estimated pop. = Total number of individuals in the first sample x size

Total number of individuals in the seconds sample

number of marked individuals recaptured