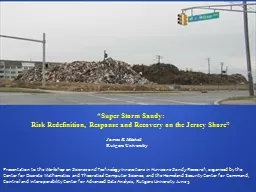
Risk Redefinition Response and Recovery on the Jersey Shore James K Mitchell Rutgers University Presentation to the Workshop on Science and Technology Innovations in Hurricane Sandy Research ID: 501867
Download Presentation The PPT/PDF document "“Super Storm Sandy:" is the property of its rightful owner. Permission is granted to download and print the materials on this web site for personal, non-commercial use only, and to display it on your personal computer provided you do not modify the materials and that you retain all copyright notices contained in the materials. By downloading content from our website, you accept the terms of this agreement.
Slide1
“Super Storm Sandy:
Risk Redefinition, Response and Recovery on the Jersey Shore”
James K. Mitchell
Rutgers University
Presentation to the
Workshop on Science and Technology Innovations in Hurricane Sandy Research
, organized by the
Center for Discrete Mathematics and Theoretical Computer Science, and the Homeland Security Center for Command, Control and Interoperability Center for Advanced Data Analysis, Rutgers University. June 5. Slide2
PLEASE NOTE
This research is ongoing. Findings are tentative, pending completion of data analysis.
Project personnel can be contacted via Professor Mitchell at: <jmitchel@rci.rutgers.edu> His mailing address is: Department of Geography, Rutgers University, 54 Joyce Kilmer Avenue, Piscataway, NJ 08854-8045.Slide3
“Post-Disaster Risk Redefinition In Small New Jersey Municipalities During The Initial Recovery Period Following Super Storm Sandy”
A National Science Foundation RAPID research project
Began: December 2012; Ends: February 2014Principal Investigators: James K. Mitchell (Rutgers U., geographer)Karen O’Neill (Rutgers U., sociologist)Melanie McDermott (Rutgers U., interdisciplinary social scientist)
Mariana Leckner (American Military U., geographer) Main objective: To identify how experts and non-experts reassess storm surge flood risks that affect small municipalities following a record-setting disaster.
Municipalities of less than 10,000 are the norm for much of coastal America. Research contributions to literature on
disaster recovery
and
risk governance
. Slide4
4 target populations & 4 techniques
Statewide (DATA COLLECTION & ANALYSIS COMPLETED)
NJ Eagleton Poll (public opinion questions, sample of c
. 800 NJ residents)Statewide and regional (DATA COLLECTION COMPLETED)Online survey,
c. 350 managers Solicited; 102 CompletedNJ Association for Floodplain Management (NJAFM)
Emergency Managers of NJ coastal counties
Local (DATA COLLECTION COMPLETED)
Interviews
with public officials in 3 case study municipalities
4 in each municipality
Mayors, Council Presidents, City Managers, Engineers, Code Officials, Emergency Managers
Focus groups
of residents in 3 case study municipalities
2 groups of 8 residents in each municipality (45 total)Slide5
Public
Opinion Polling: Statewide Population - Support For Alternative Policy Measures (%)
ALTERNATIVESTRONG SUPPORTSOMEWHAT SUPPORT
COMBINED SUPPORTRevert to pre-Sandy status
24
24
48
Abandon areas with excessive rebuilding costs
30
25
55
Convert high
risk areas to open space363571Replenish beaches373471Relocate further from shore572784Build dunes and seawalls642387Elevate buildings642387
Source: NJ Eagleton Poll, April 25, 2013
Shore county residents
display similar preferences; most opt for dunes and seawalls (84% combined); Reversion to pre-Sandy status, without other changes, is least popular (47% combined) Slide6
Online Survey of Experts:
State and Local Floodplain And Emergency Managers
(conducted January 2013; 104 respondents)Years to recoveryTourism industry 2.8Damaged Properties 4.8
Mitigation of future floods 18.1Sandy is likely to force significant improvements in flood loss reduction88% report “very likely
” or “somewhat likely”More Sandy-like events are likely:
57% say they will occur 2 or more times in next 30 years
Worsening storms
perceived as leading driver of increased risks (
30%
), followed by
increased development in flood prone areas
(
22%
)Strong reliance on ABFEs as chief source of information about future flood risks (identified by 62% of respondents), followed by Hazard Mitigation Plans (25%)Needed improvements (selected from a list of 29 possible adjustment alternatives):Public information and education programs (68%) Hazard Mitigation Plans (46%) Dune Conservation Ordinances (46%) Slide7
Characteristics Of Sandy-impacted Municipalities In Coastal New Jersey
NJ is NOT New York City
in scale, composition, functions, resourcesNYC >8 million people in one municipalityNJ >8 million people in 565 municipalities
Approximately 100 NJ municipalities affected by SandyTypical characteristics: Metropolitan edge locationSmall in area and population with a limited governmental bureaucracy
Often “built out” with few natural open spacesPrimarily residential with many homeowners (often second homeowners)
Usually ethnically homogeneous
High levels of employment in the service economy
Residents conscious of wealth/status differences among different municipalities
Strongly protective of “home rule” privileges Slide8
CASE STUDY COMMUNITIES
POPULATION
MEDIAN HOUSEHOLD INCOMEETHNICITY
BELOW POVERTY LINEManasquan 5,897
$89,074
96% White
5.0%
Oceanport
5,832
$88,080
93% White
4.0%
Union Beach
6,245 $65,65491% White 5.0%NJ Average8,791,894 $71,18069% White 9.4%Different levels of exposure to physical risks Oceanfront – Manasquan Bay front – Union Beach Riverside - OceanportSlide9
Union Beach
Oceanport
ManasquanSlide10
Focus Groups
: Knowledge Of Flooding Pre-Sandy
Well acquainted with flood risks before SandyKnowledge derived:Past personal or neighbor experience (‘92 storm, Irene)Shared community wisdom (“High Tide, Full Moon; N.E. Wind”)Common sense (“I live on the water!”)
Limited awareness of climate change as flood forcing factor Public officials, insurance agents and property sellers are main institutional sources of local flood information
Believe public institutions understate flood risks
Technical issues
Short flood history; confusion over meaning of 100 year flood
Issues of trust
Non-disclosure by real estate agents; municipal officials seen as having vested interest in stabilitySlide11
Focus Groups
: Many Uncertainties Affect Decisions To Rebuild (partial list)
Assessed value of damaged property and cost of repairsAmount of flood insurance reimbursementsCosts of future flood insurance premiumsEligibility for SBA loansEligibility for ICC grantsEligibility for Community Development Block grants
Waiting periods before funds are receivedBlocking role of banks and mortgage companies (failing to release insurance or loan monies)Degree to which new state and local guidelines for recovery are legally bindingDegree to which ABFEs and
FIRMs will be relaxed when permanent rules are adoptedMarket for damaged homesAvailability of alternative accommodations (rental or purchase)Slide12
Effect of new policy intervention
Advisory Base Flood Elevations and flood risk maps
Intended to improve resilience of coastal communities by elevating structures and improving building standards combined with adoption of actuarial flood insurance ratesReduced attention to some potential adjustmentsPreparedness and warnings, buyouts and relocation, ecosystem restoration and management, beach nourishment, holistic recoveryActs as a socio-ecological differentiation mechanism
Potential unintended effects Stretching the recovery periodWinnowing out the less affluent from the local population Increasing the proportion of rental unitsConfusion, frustration, disgruntlementSlide13
Differentiation
Emergence of three tiers of responses
1st Tier: Elevating homes to ABFEs Sometimes sustained >50% loss and eligible for ICC grantsSometimes did not sustain >50% loss and opting to elevate without ICC grantAble to rebuild using own resources Will seek available reimbursement later
2nd Tier: Waiting for clarification of uncertainties and paymentsSome may eventually elevate to ABFE levelsOthers may decide to pay higher flood insurance costs without elevating
Will wait until insurance payments, SBA loans and/or ICC grants received before rebuilding/repairing 3rd Tier: Not repairing; walking away from damaged property Perceived future: “We will either become a rich town or a welfare town.” Slide14
Small Scale Governance Units Have Fewer Recovery Choices
Constrained range of alternative hazard adaptations:
Focus on housing elevation, flood insurance, dune restorationLocal governments incur costs and receive no benefits for encouraging wider (CRS) range of measures Holistic recovery strategies fail to emerge:Environment
: Lack of significant “natural” spacesEconomy: Service economies that serve residents’ basic needsSociety: Ethnic and socioeconomic homogeneity narrows the action space for diversity-based initiatives
Larger (regional?) units offer more scope for environmental management, economic rejuvenation and social engineeringSlide15
Future Research Directions
Explore the
role of scale in the framing and interpretation of storm surge risks by exposed populationsInvestigate relationships between site level assessments made by individuals and families, community level assessments
prepared by governance institutions, and large scale (global/regional) risk assessments developed by climate scientists. Transformation of existing uncertainties
about storm surge risks during the long term recovery periodRevisit the impacted communities for follow up studies at periodic intervals; focus on the processes by which current identified uncertainties are accommodated, resolved, ignored or persist at different stages of the recovery process.
Comparative study
of the fate of new risk information in active disasters
Christchurch, New Zealand: Geotechnical information used in rebuilding program
Climate adaptation plans’ effects on post-Sandy rebuilding
Permanent adoption of
ABFEs
?
Options for pursuing holistic recovery
strategies in small municipalities