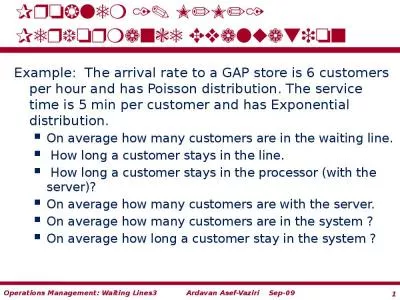
PPT-The arrival rate to a GAP store is 6 customers per hour and

Author : lindy-dunigan | Published Date : 2016-04-21

Poisson distribution The service time is 5 min per customer and has exponential distribution Problem 1 MM1 Performance Evaluation R 6 customers per hour or

Presentation Embed Code

Download Presentation

Download Presentation The PPT/PDF document "The arrival rate to a GAP store is 6 cus..." is the property of its rightful owner. Permission is granted to download and print the materials on this website for personal, non-commercial use only, and to display it on your personal computer provided you do not modify the materials and that you retain all copyright notices contained in the materials. By downloading content from our website, you accept the terms of this agreement.

The arrival rate to a GAP store is 6 customers per hour and: Transcript


Poisson distribution The service time is 5 min per customer and has exponential distribution Problem 1 MM1 Performance Evaluation R 6 customers per hour or 110 per min Rp 15 customer per minute or 6015 12hour . Problem 1. R = 6 customers per hour. Rp. =1/5 customer per minute, or 60(1/5) = 12/hour . U= R/. Rp. = 6/12 = 0.5. a) How long . does a. customer stay in the processor (with the server)?. Tp. = 5 minutes. On average how many customers are in the waiting line?. How long does a customer stay in the line?. How long does a customer stay in the processor (with the server)?. On average how many customers are there with the server? . In a barber shop business. Paxton Zhou. Paul Kim. Basic parameters. Customers arrives according to a Poisson distribution . Male and female has the . same arrival rate of 3 customers per hour. Processing time for each customer is uniformly distributed . Christian . Borgs. (MSR-NE) Jennifer T. . Chayes. (MSR-NE) Sherwin . Doroudi. (CMU-. Tepper. ) . Mor. . Harchol-Balter. (CMU-CS) . Kuang. . Xu. (MIT-LIDS). Support provided by Microsoft Computational Thinking grant. Product is manufactured and stocked in advance of demand. Inventory permits economies of scale and protects against . stockouts. due to variability of inflows and outflows. Make-to-order (MTO) process . Product is manufactured and stocked in advance of demand.. Inventory permits economies of scale and protects against . stockouts. due to variability of . interarrival. time and processing time.. Make-to-order (MTO) operations. : The characteristics of a queuing system is captured by five parameters:. Arrival pattern. Service pattern. Number of server. Restriction on queue capacity. The queue discipline. Terminology and Classification of Waiting Lines. On average how many customers are in the waiting line?. How long does a customer stay in the line?. How long does a customer stay in the processor (with the server)?. On average how many customers are there with the server? . Product is manufactured and stocked in advance. Safety inventory protects against . stockouts. due to variability of arrival time and processing time. Inventory also permits economies of scale. . Make-to-order (MTO) operations. . (. Waiting Line Models). Queuing theory.  . is . the mathematical study of waiting lines which are the most frequently encountered problems in everyday life. .. . For example, queue at a cafeteria, library, bank, etc. . Joe Loftus, Adviser: Phil Ramsey PhD. Department of Mathematics and Statistics, University of New Hampshire. Introduction:. . . We live in a time of unprecedented data collection and storage across many industries. Every day businesses are collecting information about customers, their purchases, and their habits. The end goal in collecting all this data is to turn it into valuable insights to be applied in the business setting. But how exactly is raw data translated into applicable knowledge?. Metric Explanation. The TAER was originally designed to measure TRACON performance and the impact of Traffic Management Initiatives (TMI) within 100 miles of the airport. This is not just a measure of the approach control performance, ARTCCs ability to deliver traffic evenly also impacts this measure. . Santiago . Gallino – . Tuck School of Business. Toni Moreno – Kellogg School of Management. July 2013 – LBS – London, UK . January 2017. Learning Modules. 1. Demand forecasting. 2. Inventory Decisions. hour and has Poisson distribution. The . service time is 5 min per customer . and has . Exponential distribution. . On . average how many customers are in . the waiting line.. How long a customer stays in the line..

Download Document

Here is the link to download the presentation.
"The arrival rate to a GAP store is 6 customers per hour and"The content belongs to its owner. You may download and print it for personal use, without modification, and keep all copyright notices. By downloading, you agree to these terms.

Related Documents