/
Questions Review1 October 4, 2011 Questions Review1 October 4, 2011

Questions Review1 October 4, 2011 - PowerPoint Presentation

lois-ondreau
lois-ondreau . @lois-ondreau
Follow
376 views
Uploaded On 2015-10-21

Questions Review1 October 4, 2011 - PPT Presentation

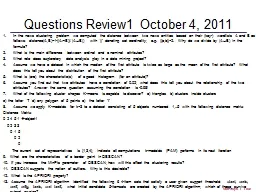
In the news clustering problem we computed the distance between two news entities based on their key wordlists A and B as follows distanceAB1A BAB with denoting set cardinality eg ID: 167951

attributes attribute distance assume attribute attributes assume distance data correlation current distribution error class decision algorithm state news relationship

Share:

Link:

Embed:

Download Presentation from below link

Download Presentation The PPT/PDF document "Questions Review1 October 4, 2011" is the property of its rightful owner. Permission is granted to download and print the materials on this web site for personal, non-commercial use only, and to display it on your personal computer provided you do not modify the materials and that you retain all copyright notices contained in the materials. By downloading content from our website, you accept the terms of this agreement.


Presentation Transcript

Slide1

Questions Review1 October 4, 2011

In the news clustering problem we computed the distance between two news entities based on their (key-) wordlists A and B as follows: distance(A,B)=1-(|A

B)|/|AB|) with ‘||’ denoting set cardinality; e.g. |{

a,b

}|=2. Why do we divide by (AB) in the formula?

What is the main difference between ordinal and a nominal attributes?

What role does exploratory data analysis play in a data mining project?

Assume we have a dataset in which the median of the first attribute is twice as large as the mean of the first attribute? What does this tell you about the distribution of the first attribute?

What is (are) the characteristic(s) of a good histogram (for an attribute)?

Assume you find out that two attributes have a correlation of 0.02; what does this tell you about the relationship of the two attributes? Answer the same question assuming the correlation is

-

0.98!

What of the following cluster shapes K-means is capable to discover? a) triangles b) clusters inside clusters

c) the letter ‘T ‘d) any polygon of 5 points e) the letter ’I’

8

.

Assume we apply K-

medoids

for k=3 to a dataset consisting of 5 objects numbered 1,..5 with the following distance matrix:

Distance Matrix:

0 2 4 5 1

object1

0 2 3 3

0 1 5

0 2

0

The current set of representatives is {1,3,4}; indicate all computations k-

medoids

(PAM) performs in its next iteration

9. What

are the characteristics of a border point in DBSCAN?

If

you increase the

MinPts

parameter of DBSCAN; how will this affect the clustering results?

DBSCAN

supports the notion of outliers. Why is this desirable?

What is the APRIORI property?

Assume

the APRIORI algorithm identified the following 6 4-item sets that satisfy a user given support threshold:

abcd

,

acde

,

acdf

,

adfg

,

bcde

, and

bcdf

;

what

initial candidate 5-itemsets are created by the APRIORI algorithm; which of those survive subset pruning? Slide2

A Few Answers Review September 23, 2010

In the news clustering problem we computed the distance between two news entities based on their (key-) wordlists A and B as follows: distance(A,B)=1

-

(|A

B)|/|AB|) with ‘||’ denoting set cardinality; e.g. |{

a,b

}|=2. Why do we divide by (AB) in the formula?

What is the main difference between ordinal and a nominal attributes?

The values of nominal attributes are ordered; this fact has to be considered when assessing similarity between two attribute values

Name two descriptive data mining methods!

What are the reasons for the current popularity of knowledge discovery in commercial and scientific applications?

Most prediction techniques employ supervised learning approaches. Explain!

What role does exploratory data analysis play in a data mining project?

Assume we have a dataset in which the median of the first attribute is twice as large as the mean of the first attribute? What does this tell you about the distribution of the first attribute?

What is (are) the characteristic(s) of a good histogram (for an attribute)?

It captures the most important characteristics of the underlying density function.

Assume you find out that two attributes have a correlation of 0.02; what does this tell you about the relationship of the two attributes? Answer the same question assuming the correlation is

-

0.98!

0.02:= no linear relation. -0.98:=a strong linear relationship exists

—if the value of one attribute goes up the value of the other goes downSlide3

More Answers

The decision tree induction algorithm, discussed in class, is a greedy algorithm. Explain!

Does not backtrack/change previously made decisions; in general, greedy algorithms center on finding a path from the current state to the goal state, and do not revise the currently taken path from the initial state to the current state.

Compute the

Gini

-gain for a 3-way split for a 3-class classification problem; the class-distribution before the split is (10, 5, 5) and after the split the class distribution is (0,0,5), (9, 2,0) and (1,3,0).

G(1/2,1/4,1/4)-(1/4*0+11/20*G(9/11.2/11,0)+4/20*G(1/4,3/4))

What is

overfitting

? What is

underfitting

? What can be done to address

overfitting

/

underfitting

in decision tree induction?

Overfitting

: the model is too complex, the training error is very low but the testing error is not minimal.

Underfitting

: the model is too simple, both training error and testing error are high.

Most decision tree learning tools use gain-ratio and not information gain; why?

Are decision trees suitable for classification problems involving continuous attributes when classes have multi-modal (

http://en.wikipedia.org/wiki/Multimodal

) distributions? Give reasons for your answer.

Yes, because