PDF-Statistics Canada — Spring 2011
Marie Drolet
Marie Drolet is with the Social Analysis Division She can be
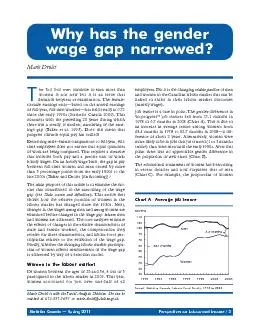
Chart AAverage job tenure
1978198319881993199820032008MonthsMenWomen331 months
67 months
Source
Download Presentation
"Statistics Canada — Spring 2011" is the property of its rightful owner. Permission is granted to download and print materials on this website for personal, non-commercial use only, provided you retain all copyright notices. By downloading content from our website, you accept the terms of this agreement.
Presentation Transcript
Transcript not available.