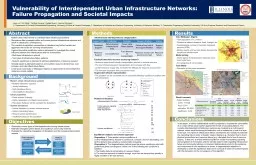
Failure Propagation and Societal Impacts Liqun Lu 1 Xin Wang 2 Yanfeng Ouyang 1 Natalie Myers 3 Jeanne Roningen 3 George Calfas 3 1 Department of Civil and Environmental Engineering ID: 616117
Download Presentation The PPT/PDF document "Vulnerability of Interdependent Urban In..." is the property of its rightful owner. Permission is granted to download and print the materials on this web site for personal, non-commercial use only, and to display it on your personal computer provided you do not modify the materials and that you retain all copyright notices contained in the materials. By downloading content from our website, you accept the terms of this agreement.
Slide1
Vulnerability of Interdependent Urban Infrastructure Networks:
Failure
Propagation and Societal Impacts
Liqun Lu
1, Xin Wang2, Yanfeng Ouyang1, Natalie Myers3, Jeanne Roningen3, George Calfas3[1. Department of Civil and Environmental Engineering, University of Illinois at Urbana-Champaign; 2. Department of Industrial and Systems Engineering, University of Wisconsin-Madison; 3. Construction Engineering Research Laboratory, US Army Engineer Research and Development Center]
Abstract
Modern cities relies heavily on interdependent infrastructure systemsDisruptions often propagate within and across physical infrastructure networks and result in catastrophic consequences.The reaction of population communities to disruptions may further transfer and aggravate the burden on surviving infrastructuresA game-theoretical equilibrium model is developed to investigate the mutual influence between the infrastructures and the communitiesMulti-layer infrastructure network Two types of infrastructure failure patterns Network equilibrium is extended to address redistribution of resource demandSocietal impact is estimated based on communities’ resource demand loss, cost increase, and total infrastructure failureA real-world case study on Maiduguri, Nigeria, is implemented to demonstrate the model and reveal insights
Background
Modern urban infrastructure systemsMultiple networked systems Jointly functioningHigh interdependencyVulnerability to disruptionsUrban populationGreat amount & densityHighly dependent on infrastructural systemPopulation behavior will be reshaped by disruptionsSystem disruptionsNatural disasters or human-induced actionsSystem cascading failureReduce system performanceInsufficient resource for population
Objectives
Methods
Results
Conclusions
A holistic mathematical model is proposed to evaluate the vulnerability of an urban infrastructure system against the threats of cascading failuresThe infrastructure systems are modeled as a multi-layered network, where each functioning infrastructure unit is modeled as a nodeTwo types of infrastructure failure mechanisms are modeled to estimate the cascading failureA network equilibrium model incorporating queueing and congestion is formulated, and mathematical proofs for equilibrium existence and uniqueness is shownA diagonalization algorithm is developed to solve the equilibrium and to compute societal impacts, with the discussion on the convergence of the algorithmThrough a case study on Maiduguri, many interesting insights are observedA system with greater resource capacity is more resilient to disruptionsDisruption happening at some “seemingly” critical infrastructures may not severely affect the entire systemMaintaining the functionality of some infrastructures may not benefit the society
…
Transportation
Power
Water
Community
System disruption propagation
Understand infrastructural interdependencies
Model cascading failure
Impact on population
Estimate population’s demand on resources
Predict people’s resource-access behavior
Resource-providing facilities
disrupted
Commodity flow based on population reaction
Generalize
various types of interdependencies among
infrastructures
Estimate
entangled system failure and equilibrium community behavior
Evaluate
the cascading propagation of disruptions
and
the consequential societal
impacts
Support Type
Realization
Example
Reason
of failure
Failure
Functional
Support
D
irect physical infrastructural links
Power cable
Water
pipeline
…
Failure of a
ny
one of the s
upport
facilities
Support failure
Resource Support
Commodity flow
Fuel delivered via transportation
Resource
access cost becomes too high
Resource failure
Infrastructural interdependency categorization
Facility/Community resource accessing behavior
Resource users travel through transportation network to acquire
resource
The cost of traversing each transportation link increases with flow
Limited resource supply also increases the difficulty for resource procurement
The demand decreases with procurement cost
Augmented network representation
The problem can be converted into an equivalent Wardrop equilibrium problem with link interactions
Problem formulation
Interdependency function
Functional support
Resource support
Initial disruption
Finite resource capacity
Nash equilibrium
System equilibrium
(1)
(2)
(3)
(4)
(5)
(6)
(7)
(8)
(9)
(10)
(11)
(12)
Equilibrium analysis and solution approach
Proposition 1.
There exists a unique equilibrium if:
(1) the interdependency function is continuous, concave, and non-decreasing, and
(2) the demand-loss penalty is monotonically increasing.
Proposition 2.
The diagonalization method gives the unique equilibrium point with guaranteed global convergence if either one of the following two conditions is satisfied:
i
) The facility status is not sensitive to resource failure;
ii) The resource demand is inelastic enough, such that the demand-loss penalty is
highly sensitive
to the lost demand
City: Maiduguri, Nigeria
Total population of 1.2 million
Occasional natural disasters: flood, draught, etc.
Overwhelming number of internally displaced persons (IDPs)
Military events and terrorist attacks threaten the people and infrastructure
Model setting
Seven layers of infrastructure networks and a community layer
Six categories of communities
Case Study
Disruption at the power substation
Different
scenarios
Food
Water
Access cost increment
Population lost resource
Failed
facilities
(total 11)
Access cost increment
Population lost resource
Failed
facilities
(total 28)
0: Case
Study
-7%
0.0%
0.0
458%
4.3%
17.5
1: No Queueing Cost
-36%
0.0%
0.0
0.5%
0.0%
18.0
2:
Moderate
resource cap.
-49%
0.0%
0.0
-25%
0.0%
17.53: High resource cap.-54%0.0%0.0-35%0.0%17.54: Init. Water-27%0.0%0.020%2.9%9.35: Init. Fuel22%1.3%0.5157%5.9%10.66: Water and Fuel-2%0.0%0.3860%8.7%16.2
Result summary
Failed facilities:
water: 17.5/28
food: 0.0/11
education: 84.0/84
healthcare: 4.0/4