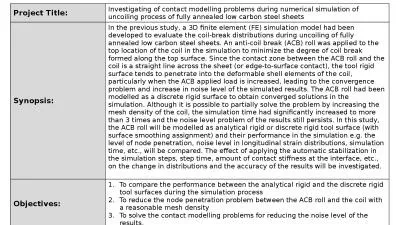
/
An Introduction to Statecharts Modelling and Simulation An Introduction to Statecharts Modelling and Simulation

An Introduction to Statecharts Modelling and Simulation - PowerPoint Presentation

luanne-stotts
luanne-stotts . @luanne-stotts
Follow
378 views
Uploaded On 2018-02-08

An Introduction to Statecharts Modelling and Simulation - PPT Presentation

Simon Van Mierlo simonvanmierlouantwerpenbe Hans Vangheluwe hansvangheluweuantwerpenbe Complex Systems Complexity timed autonomous reactive to events behaviour In contrast to ID: 629185

red light simulation yellow light red yellow simulation yakindu green workflow environment plant time police systems statecharts vangheluwe observe

Share:

Link:

Embed:

Download Presentation from below link

Download Presentation The PPT/PDF document "An Introduction to Statecharts Modelling..." is the property of its rightful owner. Permission is granted to download and print the materials on this web site for personal, non-commercial use only, and to display it on your personal computer provided you do not modify the materials and that you retain all copyright notices contained in the materials. By downloading content from our website, you accept the terms of this agreement.


Presentation Transcript

Slide1

An Introduction to Statecharts Modelling and Simulation

Simon Van Mierlosimon.vanmierlo@uantwerpen.be

Hans Vangheluwe

hans.vangheluwe@uantwerpen.beSlide2

Complex Systems

Complexity:

timed

,

autonomous

,

reactive

(to

events

)

behaviour

.

In contrast to

transformational

systems, which take input and, eventually, produce output.Slide3

Modelling Reactive Systems

Interaction with the environment: reactive to events.Autonomous behaviour:

timeouts.Describe system with modes (hierarchical) and concurrent units.Use programming language + threads and timeouts (OS)?

1E. A. Lee, "The problem with threads," in Computer, vol. 39, no. 5, pp. 33-42, May 2006.

“Nontrivial software written with threads, semaphores, and

mutexes

are incomprehensible to humans”

1

Programming language (and OS) is too low-level

-> most appropriate formalism: “what” vs. “how”Slide4

Discrete-Event AbstractionSlide5

Statecharts

Visual (topological, not geometric) formalism.Precisely defined syntax and semantics.Many uses:Documentation (for human communication)

Analysis (of behavioural properties)SimulationCode synthesis… and derived, such as testing, optimization, …Slide6

Statecharts History

Introduced by David Harel in 19871Notation based on higraphs = graphs combined with Venn diagramsSemantics extend deterministic finite state automata with:

Depth (Hierarchy)OrthogonalityBroadcast CommunicationTimeHistorySyntactic sugar, such as enter/exit actions

2David Harel, Statecharts: a visual formalism for complex systems, Science of Computer Programming, Volume 8, Issue 3, 1987, Pages 231-274Slide7

Running Example

(Physical) Plant

Environment

Controller

input

output

<<observe>>

<<act>>Slide8

Deployment

(Physical) Plant

Environment

Controller

system

input

system

output

<<observe>>

<<act>>

(Simulated) Plant

1

2Slide9

Workflow

3

Hans Vangheluwe and Ghislain C. Vansteenkiste. A multi-paradigm modeling and simulation methodology: Formalisms and languages. In European Simulation Symposium (ESS), pages 168-172. Society for Computer Simulation International (SCS), October 1996. Genoa, Italy.

4

FTG+PM: An Integrated Framework for Investigating Model Transformation Chains, Levi Lúcio, Sadaf Mustafiz, Joachim Denil, Hans Vangheluwe, Maris Jukss. System Design Languages Forum (SDL) 2013, Montreal, Quebec. LNCS Volume 7916, pp 182-202, 2013.Slide10

Requirements

R1: Three differently colored lights: red, green, yellow.R2: At most one light is on at any point in time.R3: Initially, the red light is on.

R4: Cycles through red on, green on, and yellow on.R5: Duration: Red -> 60s, Green -> 50s, Yellow -> 10sR6: Police can interrupt autonomous operation.Result = blinking yellow light (on -> 1s, off -> 1s).R7: Police can resume an interrupted traffic light.Result = light which was on at time of interrupt is turned on again.

5s

3s

2sSlide11

WorkflowSlide12

States

R1: Three differently colored lights: red, green, yellow.

R2: At most one light is on at any point in time.

Environment

(Simulated) Plant

<<observe>>

{R: on, Y: off, G: off}

{R: off, Y: off, G: on}

{R: off, Y: on, G: off}Slide13

Default State

R1: Three differently colored lights: red, green, yellow.

R2: At most one light is on at any point in time.

R3: Initially, the red light is on.

Environment

(Simulated) Plant

<<observe>>

{R: on, Y: off, G: off}

{R: off, Y: off, G: on}

{R: off, Y: on, G: off}Slide14

Transitions

event(params) [guard] / output_action(params)

R1: Three differently colored lights: red, green, yellow.

R2: At most one light is on at any point in time.

R3: Initially, the red light is on.R4: Cycles through red on, green on, and yellow on.R5: Duration: Red -> 5s, Green -> 3s, Yellow -> 2s

Environment

(Simulated) Plant

<<observe>>

{R: on, Y: off, G: off}

{R: off, Y: off, G: on}

{R: off, Y: on, G: off}Slide15

Yakindu1: Modelling

5

https://www.itemis.com/en/yakindu/state-machine/Slide16

WorkflowSlide17

Yakindu: SimulationSlide18

WorkflowSlide19

Hierarchy

R6: Police can interrupt autonomous operation.

Result = blinking yellow light (on -> 1s, off -> 1s).R7: Police can resume an interrupted traffic light.

FLATTEN

Semantics/Meaning?Slide20

Hierarchy: Modified Example

FLATTEN

Statemate, Yakindu, …

Rhapsody, …

Semantics/Meaning?

(unwanted) non-determinism!

determinism!Slide21

Yakindu: HierarchySlide22

History

R7: Police can resume an interrupted traffic light.

Result = light which was on at time of interrupt is turned on again.

H

H*

shallow

history

deep

historySlide23

Yakindu: HistorySlide24

Concurrency

FLATTEN

Semantics/Meaning?Slide25

WorkflowSlide26

Yakindu: SimulationSlide27

WorkflowSlide28

Statecharts Testing

Generator

System Under Study

Acceptor

6

Zeigler BP. Theory of modelling and simulation. New York: Wiley-

Interscience

, 1976.

7

Mamadou

K.

Traoré

, Alexandre

Muzy

, Capturing the dual relationship between simulation models and their context,

Simulation Modelling Practice and Theory, Volume 14, Issue 2, February 2006, Pages 126-142Slide29

Orthogonal Components (White-Box)Slide30

WorkflowSlide31

Yakindu: TestingSlide32

Yakindu: Testing

Interface

Synchronization

CallbackSlide33

Yakindu: TestingSlide34

WorkflowSlide35

Code Generation

interrupts

Interface

:

setRed(boolean)setGreen(boolean)setYellow(boolean)

Interface

:

in event

police

eventsSlide36

Generated Code

Files

Sample

8 files

1311 lines of code302 manual (UI) codeSlide37

Interface

Runner

Generator

Setup CodeSlide38

Deployed ApplicationSlide39

Recap

Model the behaviour of complex, timed, reactive, autonomous systems.“What” instead of “How” (= implemented by Statecharts compiler)Abstractions:

States (composite, orthogonal)TransitionsTimeoutsEventsTool support:YakinduSCCD8

8 Simon Van Mierlo, Yentl Van Tendeloo, Bart Meyers, Joeri

Exelmans, and Hans Vangheluwe. SCCD: SCXML extended with class diagrams. In 3rd Workshop on Engineering Interactive Systems with SCXML, part of EICS 2016, 2016.