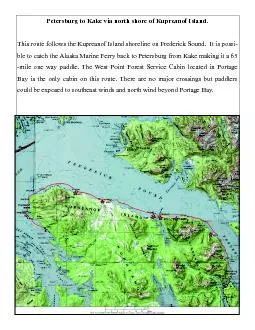
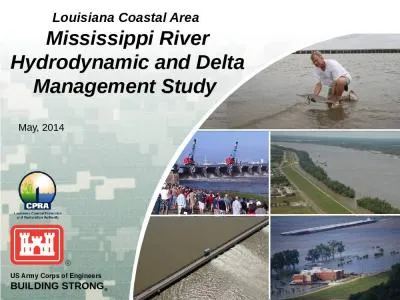
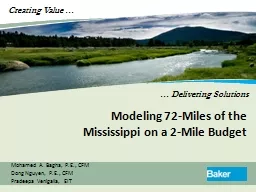
/
Modeling 72-Miles of the Mississippi on a 2-Mile Budget Modeling 72-Miles of the Mississippi on a 2-Mile Budget

Modeling 72-Miles of the Mississippi on a 2-Mile Budget - PowerPoint Presentation

luanne-stotts
luanne-stotts . @luanne-stotts
Follow
342 views
Uploaded On 2019-06-22

Modeling 72-Miles of the Mississippi on a 2-Mile Budget - PPT Presentation

Mohamed A Bagha PE CFM Dong Nguyen PE CFM Pradeepa Venigalla EIT Background CF3R Comprehensive Flood Risk Resources and Responses IDIQ JV for FEMA Region VI Baker Managing Partner ID: 759651

Share:

Link:

Embed:

Download Presentation from below link

Download Presentation The PPT/PDF document "Modeling 72-Miles of the Mississippi on ..." is the property of its rightful owner. Permission is granted to download and print the materials on this web site for personal, non-commercial use only, and to display it on your personal computer provided you do not modify the materials and that you retain all copyright notices contained in the materials. By downloading content from our website, you accept the terms of this agreement.


Presentation Transcript

Slide1

Modeling 72-Miles of the Mississippi on a 2-Mile Budget

Mohamed A. Bagha, P.E., CFM

Dong Nguyen, P.E., CFM

Pradeepa Venigalla, EIT

Slide2

Background

CF3R - Comprehensive Flood Risk Resources and Responses - ID/IQ JV for FEMA Region VI.

Baker - Managing Partner

Multiple County DFIRM Task Order (2008)

Texas (7 Counties)

Louisiana (3 counties)

Arkansas (9 counties)

Slide3

Arkansas Counties

Southern ArkansasAshleyChicotDeshaDrew

Slide4

Major Rivers in South-East Arkansas

Slide5

Scope

1st time Countywide DFIRM StudiesNo New H & H studies on any streams

Slide6

Areas of Moderate Flood Risk, Subject to 0.2% Annual Chance Flood

Includes Areas Subject to Shallow Flooding

Areas of Residual Risk Behind Accredited and Provisionally Accredited Levees

No BFEs or Flooding Depths Shown on FIRMs

What Does a Shaded Zone X Area Mean?

Purchase of Flood Insurance Not Mandatory

Statistically, a 0.2% Chance Flood has a

6%

Chance of Occurring During a 30-Year Period

Slide7

Levee Systems

Slide8

Levee Guidelines & Specifications for Levees

FEMA G &S Appendix HGuidance for Mapping of Areas Protected by Levee Systems (2003)5 Memos since: 34, 43, 45, 51, 532005 - 2009

Slide9

Create / Obtain Hydraulic Modeling along

Levee’d Stream

Fail Entire Levee, not only localized breach

Delete entire embankment and levee identifiers from geometry

Extend Cross sections on overbanks

Ideal procedure – Mapping Residual Risk

Re-run model in without-levee mode

Map resulting residual risk floodplain

Slide10

However…

Limited Modeling Available along Mississippi River in SE Arkansas.

1

Complete Hydraulic Model Not Available for Study Area

2

COE Memphis District Provided a HEC-RAS Model of the Mississippi River 1% chance Flood from RM 956.97 to RM 594

3

COE Vicksburg District Provided Cross Section Geometry & Reach Lengths for HEC-2 Model from RM 621.03 to RM 321

4

No Peak Discharges or Manning’s ‘n’ Values Provided in Vicksburg District HEC-2 Model

Slide11

Key Cross Sections

Slide12

Maintain Quality

of Product

Challenges

Limited FEMA Funding Per Countywide Study

Compressed Schedule Delayed by Certification Process

Follow Relevant FEMA Procedure Guidelines

Create Model for

Shaded X Floodplains

for all Levees

Slide13

Conceptualization

Alternative Modeling

Defendable & Reasonable

Consistent with and ties into previous Studies

Economical - a Detailed Study of the Mississippi Along this Reach May Prove Very Expensive

Concurrence on Approach from RMC 6 and FEMA Region VI Vital

Compressed Schedule - with delays due to PAL Requests, little time to complete task

Slide14

Memphis & Vicksburg HEC Models

Cross sections located using USACE MVD Navigation Book www.mvd.usace.army.mil/Gis/navbook/html/corps.htm

Slide15

Geometry

Slide16

HEC Geo-RAS Data Extracted from USGS DEM and Cross Sections

Overlay with Cross Section from HEC-RAS and HEC-2 Models

Use Surveyed Elevation Data in channels and on overbanks where Available

Supplement cross section overbanks with USGS

Contour DEM Data

Geometry- Splicing Cross Sections

Extend Cross Sections across county boundaries

Determine appropriate Manning’s ‘n’ for overbanks.

Slide17

Splicing Cross Sections

Vicksburg COE HEC-2 Cross Section 590.4.

Slide18

Splicing Cross Sections

HEC-RAS channel data + USGS DEM @ XS 590.4

Slide19

Cross Section Layout

Slide20

Chicot County Detailed Study

BFEs along Mississippi River in Chicot CountyCOE, Vicksburg StudyNo Peak DischargesNo Floodway Data1979 FIS report.

Slide21

Hydrology 101  1 + 1 + 1 ≠ 3

Slide22

Efficiencies: Reverse Engineering

Sensitivity Analyses

2 variables- Manning’s ‘n’ and Q

100

While holding the Channel ‘n’ values steady:

Determine the % of flow addition that results in computed W.S. Elevations at Chicot County limits matching 1979 BFEs.

Multiple Profiles set up, each profile with Incremental Discharges.

40% of Arkansas River & White River

peak discharges added yield best match with 1979 BFEs on Mississippi River in Chicot Co.

Slide23

Efficiencies: Reverse Engineering (Cont’d)

While holding peak discharges constant:

Vary Manning’s ‘n’ values - ± 25%.

Upstream cross sections in Memphis COE HEC-RAS model show minimal WS Elevation change.

Results: Variation in ‘n’ values did not cause significant impact to W.S. Elevations along the Mississippi River.

Conclude that Model is sensitive to

Q variation rather than ‘n’ variation.

Slide24

Efficiencies: Reverse Engineering (Cont’d)

Chicot County (with 1979 BFEs)

Slide25

Bayou Bartholomew

Longest Bayou in the worldFlows ~375 milesParallel to Mississippi RiverConveys up to 7,500 cfs Drainage area: 1,110 sq. mi.Major conveyance systemShaded Zone X for Mississippi River West Bank levee will not extend west beyond this bayouLevee-like features (railroad & highway embankments) cannot be used as alternative.

Slide26

Resulting Multi-County Shaded X floodplain

Slide27

DFIRM – Desha County Panel 0250

Red Fork Bayou

Carter Bayou

Slide28

Summary

HEC-RAS along Mississippi across two counties.

Seamlessly integrated geometry (Vicksburg COE) with Memphis COE HEC-RAS model .

Cross sections extended on right overbank using USGS Topographic data.

Peak discharges estimated.

Manning’s ‘n’ values determined.

Shaded Zone X extents mapped.

Future studies in Northern Louisiana impacted.

Slide29

Conclusion

Creative Approach to resolve missing data issue.

Quality End-Product - FEMA requirements.

Residual Risk Mapping has solid technical basis.

Short Schedule

2 week turnaround.

Limited Budget

3 member team to conceptualize, coordinate, process and report on results

Effective Coordination

Between Study contractor, RMC6, FEMA and USACOE Districts (Memphis and Vicksburg)

Slide30

Questions?