/
x0000x0000 2019 Michael C Ekwe Asma T Ibrahim Ifeoluwa A Balogun Oluwa x0000x0000 2019 Michael C Ekwe Asma T Ibrahim Ifeoluwa A Balogun Oluwa

x0000x0000 2019 Michael C Ekwe Asma T Ibrahim Ifeoluwa A Balogun Oluwa - PDF document

luna
luna . @luna
Follow
342 views
Uploaded On 2021-08-27

x0000x0000 2019 Michael C Ekwe Asma T Ibrahim Ifeoluwa A Balogun Oluwa - PPT Presentation

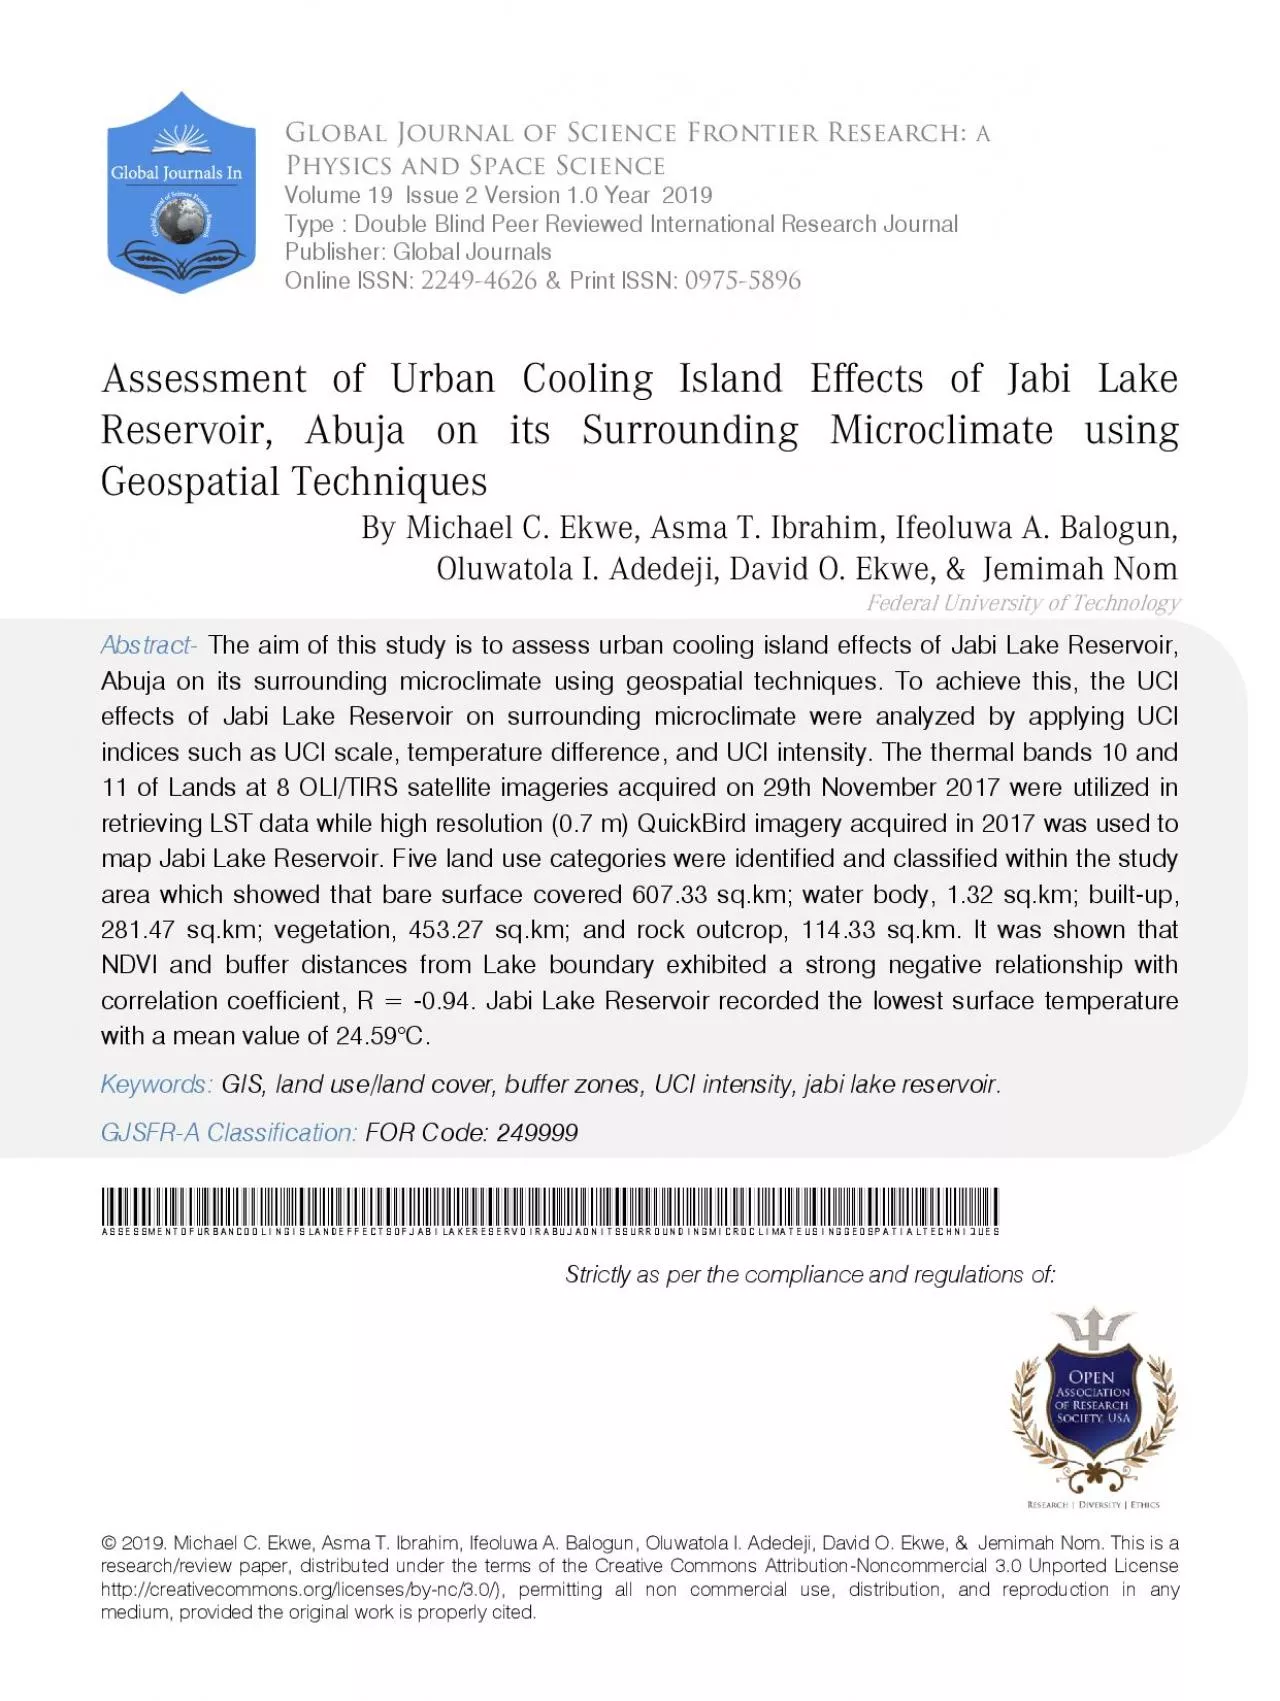
xMCIxD 10xMCIxD 10 Assessment of Urban Cooling Island Effects of Jabi Lake Reservoir Abuja on its Surrounding Microclimate using Geospatial Techniques By Michael C Ekwe Asma T Ibra ID: 873293

urban lake reservoir jabi lake urban jabi reservoir uci buffer temperature surface band abuja study intensity effects island cooling

Share:

Link:

Embed:

Download Presentation from below link

Download Pdf The PPT/PDF document "x0000x0000 2019 Michael C Ekwe Asma T Ib..." is the property of its rightful owner. Permission is granted to download and print the materials on this web site for personal, non-commercial use only, and to display it on your personal computer provided you do not modify the materials and that you retain all copyright notices contained in the materials. By downloading content from our website, you accept the terms of this agreement.


Presentation Transcript

1 ��© 2019. Michael C. Ekwe,
��© 2019. Michael C. Ekwe, Asma T. Ibrahim, Ifeoluwa A. Balogun, Oluwatola I. Adedeji, David O. Ekwe, & Jemimah Nom. This is a research/review paper, distributed under the terms of the Creative Commons Attribution-Noncommercial 3.0 Unported License http://creativecommons.org/licenses/by-nc/3.0/), permitting all non commercial use, distribution, and reproduction in any medium, provided the original work is properly cited. &#x/MCI; 10;&#x/MCI; 10; Assessment of Urban Cooling Island Effects of Jabi Lake Reservoir, Abuja on its Surrounding Microclimate using Geospatial Techniques By Michael C. Ekwe, Asma T. Ibrahim, Ifeoluwa A. Balogun, Oluwatola I. Adedeji, David O. Ekwe, & Jemimah Nom Federal University of Technology Abstract- The aim of this study is to assess urban cooling island effects of Jabi Lake Reservoir, Abuja on its surrounding microclimate using geospatial techniques. To achieve this, the UCI effects of Jabi Lake Reservoir on surrounding microclimate were analyzed by applying UCI indices such as UCI scale, temperature difference, and UCI intensity. The thermal bands 10 and 11 of Lands at 8 OLI/TIRS satellite imageries acquired on 29th November 2017 were utilized in retrieving LST data while high resolution (0.7 m) QuickBird imagery acquired in 2017 was used to map Jabi Lake Reservoir. Five land use categories were identified and classified within the study area which showed that bare surface covered 607.33 sq.km; water body, 1.32 sq.km; built-up, 281.47 sq.km; vegetation, 453.27 sq.km; and rock outcrop, 114.33 sq.km. It was shown that NDVI and buffer distances from Lake boundary exhibited a strong negative relationship with correlation coefficient, R = -0.94. Jabi Lake Reservoir recorded the lowest surface temperature with a mean value of 24.59°C. Keywords: GIS, land use/land cover, buffer zones, UCI intensity, jabi lake reservoir. GJSFR-A Classification: FOR Code: 249999 AssessmentofUrbanCoolingIslandEffectsofJabiLakeReservoirAbujaonitsSurroundingMicroclimateusingGeospatialTechniques Strictly as per the compliance and regulations of : Global Journal of Science Frontier Research: APhysics and Space ScienceVolume 19 Issue 2 Version 1.0 Year 2019 Type: Double Blind Peer Reviewed International Research Journ

2 alPublisher: Global Journals Online ISSN
alPublisher: Global Journals Online ISSN:2249-4626 &Print ISSN:0975-5896 Assessment of Urban Cooling Island Effects of Jabi Lake Reservoir, Abuja on its Surrounding Microclimate using Geospatial Techniques Michael C. Ekwe r, Asma T. Ibrahim , Ifeoluwa A. Balogun Œ, Oluwatola I. Adedeji \r, David O. Ekwe ¥, & Jemimah Nom § Abstract- The aim of this study is to assess urban cooling island effects of Jabi Lake Reservoir, Abuja on its surrounding microclimate using geospatial techniques. To achieve this, the UCI effects of Jabi Lake Reservoir on surrounding microclimate were analyzed by applying UCI indices such as UCI scale, temperature difference, and UCI intensity. The thermal bands 10 and 11 of Lands at 8 OLI/TIRS satellite imageries acquired on 29th November 2017 were utilized in retrieving LST data while high resolution (0.7 m) QuickBird imagery acquired in 2017 was used to map Jabi Lake Reservoir. Five land use categories were identified and classified within the study area which showed that bare surface covered 607.33 sq.km; water body, 1.32 sq.km; built-up, 281.47 sq.km; vegetation, 453.27 sq.km; and rock outcrop, 114.33 sq.km. It was shown that NDVI and buffer distances from Lake boundary exhibited a strong negative relationship with correlation coefficient, R = -0.94. Jabi Lake Reservoir recorded the lowest surface temperature with a mean value of 24.59°C. Further results show that surface temperatures depicted an increasing trend from 27.86°C at 50m to peak value of 30.96°C at 500m buffer zone. Results also depicted that the Lake had the highest effect on areas within the 50m buffer zone with an intensity value of 0.065°C/m while localities within 100m buffer zone and beyond showed decreasing intensities from 0.042°C/m at 100m to 0.013°C/m at 500m buffer zone. Regression analysis results depicted that UCI intensity had a strong negative relationship with buffer distances from the Jabi Lake boundary with correlation coefficient, R = -0.88.The findings of this study can be adopted and applied to analyze priority areas within the humid and tropical cities in Nigeria for the creation, design, management or restoration of new water spaces. Keywords: GIS, land use/land cover, buffer zones, UCI intensity, jabi lake reservoir. I. Introduction ue to urbanization and urban-populat

3 ion exponential growth, urban heat islan
ion exponential growth, urban heat island (UHI) intensities are frequently occurring in urban centers as a result of the conversion of green areas and water spaces to impervious surfaces. One of the most noticed consequences of land use/land cover changes and global warming is the UHI which is one of the straight representations of environmental issues. The higher urbanized area leads to added distinct UHI with enormous temperature differences between urban and rural areas (Chibuike et al., 2018). Because this phenomenon can result in heat-related diseases and death, there is a global effort to mitigate it which is in the form of urban water spaces restoration and green infrastructure expansion. Observations have shown that temperatures of urban centers can be up to 12 °C higher than neighboring regions (Voogt, 2002). Urban water spaces and green areas such as parks, in particular, can provide conducive and comfortable environments for the citizens which at the same time help in controlling urban temperature (Taha, 1991). Contrary to UHI, areas within the urban centers with low surface temperatures compared with their environs are known as urban cooling islands (UCI) (Ca et al., 1998). The urban cooling island effect is created mainly by evapotranspiration effects by water spaces and green areas as well as the shading effect of urban trees (Rosenzweig et al., 2007). Several researchers have proved that recreational parks have subduing effect on urban thermal temperatures called the park cooling island (PCI) effect which serves as an effective approach to mitigate UHI phenomenon(Spronken-Smith and Oke, 1998; Chang et al., 2007; Zhang et al., 2009; Cao et al., 2010; Edward et al., 2012; Armson et al., 2012; Mackey et al., 2012; Gago et al., 2013; Chibuike et al., 2018; Balogun and Daramola, 2018). In UCI, water spaces such as lakes are relatively more efficient in mitigating UHI effect than green areas due to a higher rate of evapotranspiration. Water spaces, therefore serve as cooling islands in urban centers due to the temperature difference of their surrounding environment (Sun and Chen, 2012; Gober et al., 2010; Hathway and Sharples, 2012).The aim of D 1 GlobalJournalofScienceFrontierResearch VolumeXIX Issue ersion IVIIYear 2019 37 (A)©2019 Global Journals Authorr\rÅ:Climate Change and Modelling Division

4 , Strategic Space Applications Departmen
, Strategic Space Applications Department, National Space Research and Development Agency, Nigeria.e-mail: ekwemichael2005@gmail.comAuthorŒ:Department of Meteorology and Climate Science, School of Earth and Mineral Sciences, Federal University of Technology, P.M.B. 704, Akure, Ondo State, NigeriaAuthor ¥:Natural Resources Management Division, Strategic Space Applications Department, NationalSpace Research and Development Agency, NigeriaAuthor §:National Weather Forecasting & Climate Research Centre, Nigerian Meteorological Agency, P.M.B. 615, Nnamdi Azikiwe International Airport, Abuja, Nigeria. this study is to present management and planning information on Jabi Lake Reservoir, Abuja to mitigate UHI, by assessing the effects on the surrounding microclimate due to the characteristics of the Lake. II. Study Area and Data Acquisition a) The study area The study area is Jabi Lake Reservoir and its environs located in the FCT, Abuja, Nigeria. It lies within latitude 9.04°N - 9.12°N and longitude 7.38 °E - 7.49°E.The lake covers a total surface area of approximately 1,316 hectares. The master plan for Abuja and the FCT was developed by International Planning Associates (IPA) with five consortiums (Eleh, 2001). Being centrally located, the study area is blessed with a mix of agricultural activities and produce such as tubers and root crops of the south (yams, cassava, maize, and plantains) and grain (sorghum, guinea corn, and rice) of the north. The creation of the new Federal Capital Territory (FCT) and its capital, Abuja, represents perhaps the most important instrument for enhancing the overall socio-economic development of the entire middle belt of Nigeria (Abumere, 1984). The influence of climate variability on lake water recharge is envisaged especially during wet seasons. The peculiarity of Jabi Lake and its environs as a Savannah Zone vegetation of the West African sub-region makes it unique for change pattern analysis as a result of urbanization and population growth. The temperature in the study area ranges between 28°C to as high as 39 °C in the dry season. Rainfall is highest in August (WMO, 2016). According to Koppen’s climate classification, the city exhibits rainy/wet and dry/hot climate respectively. There is the presence of short harmattan season characterized dry and dusty northeasterly trade winds which blow from the

5 Sahara Desert over West Africa with the
Sahara Desert over West Africa with the resultant cold and dry weather conditions especially around November to early March. The rainfall pattern in the city is affected by its location at the windward side of Jos and located at the zone of convergence receiving frequent rainfall during the monsoon season (Touristlink, 2013). 1 GlobalJournalofScienceFrontierResearch VolumeXIX Issue ersion IVIIYear 2019 38 (A)©2019 Global Journals Assessment of Urban Cooling Island Effects of Jabi Lake Reservoir, Abuja on its Surrounding Microclimate using Geospatial Techniques Fig. 1: Map of the Study Area Showing Jabi Lake Reservoir and its Environsb) Data Cloud-free Landsat 8 OLI/TIRS satellite imageries for 29th November 2017 of Path 189 and Row 054 with less than 10% cloud cover was downloaded from the United States Geological Survey (USGS) Earth Explorer data website (http://earthexplorer.usgs.gov) and this was used to classify the study area and its environs into different landuse categories namely water body, vegetation, rock outcrop, built-up and bare surface using the Maximum Likelihood Classification algorithm in ArcGIS 10.4.1 software. Bands 10 and 11 which are the thermal bands of Landsat 8 OLI/TIRS mainly used for thermal studies (Rida et al., 2016) were used to retrieve the land surface temperatures (LST) of the Lake and its environs while bands 5 and 4 were utilized in estimating the Normalized Difference Vegetation Index (NDVI) for the area. The importance of Landsat data in environmental studies, monitoring, and climate issues cannot be over-emphasized (Alavipanah et al., 2010; Mfondoum et al., 2016; Narayan et al., 2016). 1 GlobalJournalofScienceFrontierResearch VolumeXIX Issue ersion IVIIYear 2019 39 (A)©2019 Global Journals Assessment of Urban Cooling Island Effects of Jabi Lake Reservoir, Abuja on its Surrounding Microclimate using Geospatial Techniques Table 1: Band properties of Lands at 8 OLI/TIRSBand Name Band Width (m) Resolution (m) Band 1 Coastal 0.43–0.45 30 Band 2 Blue 0.45–0.51 30 Band 3 Green 0.53–0.59 30 Band 4 Red 0.64–0.67 30 Band 5 (NIR) 0.85–0.88 30 Band 6 SWIR 1 1.57–1.65 30 Band 7 SWIR 2 2.11–2.29 30 Band 8 Panchromatic 0.5–0.68 15 Band 9 Cirrus 1.36–1.38 30 Band 10 TIRS 1 10.6–11.19 100 Band 11 TIRS 2 11.5–12.51 100 Source: Landsat 8 User Handbook Manual, (2016) I

6 II. Methodology a) Generation of Normali
II. Methodology a) Generation of Normalized Differences Vegetation Index (NDVI) Map The Normalized Difference Vegetation Index (NDVI) is a measure of the amount and vigor of vegetation at the surface. The reason NDVI is related to vegetation is that healthy vegetation reflects very well in the near infrared part of the Electromagnetic Spectrum. The index is defined by the equation below for Lands at 8 OLI/TIRS, NDVI=Band 5\rFBand 4Band 5+Band 4 (1) Where band 5 and band 4 are the reflectance bands in the near-infrared and red portion of the Electromagnetic Spectrum of Operation Land Imager (OLI) sensor of Lands at 8 respectively. The value is normalized to -”1'9,”WRSDUWLDOO\DFFRXQWIRUdifferences in illumination and surface slope. Negative values correspond to water, values close to zero, but positive values correspond to soils and further, from 0.2 to 0.6 indicate the presence of surfaces vegetated with maximum values around 0.8 for very dense vegetation. b) Land Surface Temperature (LST) Retrieval Land surface temperature is defined as the radiative temperature of the land surface (Ghent et al., 2010). It is influenced by albedo, soil moisture and vegetation cover (http://land.copernicus.eu/global /products/lst). The surface can include ice, snow, bare soil, grass, or the roofs of buildings. Usually, LST is measured by remote sensing. LST using Lands at 8 OLI/TIRS can be calculated using the following steps: Step 1: The Digital Numbers (DNs) of bands 10 and 11 from the Lands at 8 OLI/TIRS were first converted to spectral radiance using: Lands at 8 with header file data on Radiance Multiplier (ML) and Radiance Add (AL), the thermal infrared (TIR) band was converted into spectral radiance (LI) using the approach provided by Chander and Markhan (2003) and the Lands at 8OLI science Data Users Handbook: LI=(ML×QCal)+AL (2) Where LI= Top of Atmosphere (TOA) spectral radiance (Wm-2sr-1m-1), /.= Band-specific multiplicative rescaling factor from the metadata (RADIANCE_MULT_BAND_x, where x is the band number), #. = Band-specific additive rescaling factor from the metadata (RADIANCE_ADD_BAND_x, where x is the band number), and 3%=H = Quantized and calibrated standard product pixel values (DN). Step 2: The effective at-sensor brigh

7 tness temperature (TB) also known as bla
tness temperature (TB) also known as black body temperature was obtained from the spectral radiance using Plank’s inverse function: Spectral radiance values for bands10 and 11 were converted to radiant surface temperature under an assumption of uniform emissivity using pre-launch calibration constants for the Lands at 8 OLI/TIRS sensor implemented into the following equation: TB=K2In\rlK1LI +1\rp \rF273.15 (3) Where TB = radiant surface temperature (in Degree Celsius), LI= Top of Atmosphere (TOA) spectral radiance (Wm-2sr-1m-1), K1 =Band-specific thermal conversion constant from the metadata (K1_CONSTANT_BAND_x, where x is the thermal band number), K2 = Band-specific thermal conversion constant from the metadata (K2_CONSTANT_BAND_x, where x is the thermal band number).All pre-launch calibration constants used in the equation above were supplied by the Lands at Project Science Office (2001). 1 GlobalJournalofScienceFrontierResearch VolumeXIX Issue ersion IVIIYear 2019 40 (A)©2019 Global Journals Assessment of Urban Cooling Island Effects of Jabi Lake Reservoir, Abuja on its Surrounding Microclimate using Geospatial Techniques Table 2: Lands at 8 OLI/TIRS Calibration Constants &#x/MCI; 20;&#x/MCI; 20; &#x/MCI; 30;&#x/MCI; 30; &#x/MCI; 40;&#x/MCI; 40;Data K1 (Wm-2sr-1m-1) K2 (Wm-2sr-1m-1) Landsat 8 OLI TIRS-1 774.89 1321.08 Landsat 8 OLI TIRS-2 480.89 1201.14 Step 3: Land surface Emissivity Estimation: According to Sobrino et al., (2004), the emissivity is calculated using equation 4: B=0.004×PV+0.986 (4) Where 28 is the vegetation proportion obtained using; PV=BNDVI\rFNDVIminNDVImax\rFNDVImin C2 (5) Where NDVImax= maximum value of NDVI and NDVImin= minimum value of NDVI. Step 4: The calculated radiant surface temperatures were successively corrected for emissivity using the equation: LST=TB1+(I×TB/O)×InB (6) Where LST is land surface temperature (in Degree Celsius), TB is radiant surface temperature (in Degree Celsius),  is the wavelength of emitted radiance (10.8m for band 10 and 12m for band 11 respectively), ! is h×c/1 (1.438×10ï2mK), h is Planck’s constant (6.26×10⁻³⁴J s), c is the velocity of light (2.998×10⁸ m/sec)

8 , 1 is Stefan Boltzmann’s constant (1.3
, 1 is Stefan Boltzmann’s constant (1.38×10⁻²³J K-1), and 0 is land surface emissivity. c) Determination of Urban Cooling Island (UCI) Indices and its Relationship with Distance from Lake Boundary i. Definition of Jabi Lake Reservoir in this study Jabi Lake Reservoir is defined as natural spaces that have significant accumulation of water which serves as an area for storing water surrounded by different land use types such as built-up. The Lake's shape file was extracted and digitized from high-resolution QuickBird Imagery of 2017. ii. UCI Indices UCI indices in this study are defined according to Sun et al., (2012). The indices include UCI scale, temperature difference, and UCI intensity. UCI scale is defined as the distance from the boundary of water spaces to a buffer zone which has the maximum temperature. The temperature difference is the difference between the temperature of water spaces and the mean temperature on the UCI scale. UCI intensity is the water temperature difference per unit distance (equation 7). Increase in UCI gradient implies rising temperature at buffer zones further away from the water boundary. To identify UCI indices, ten (10) buffer zones around the Jabi Lake Reservoir were created at 50m intervals (i.e., 50m, 100m, 150m, 200m, 250m, 300m, 350m, 400m, 450m, and 500m). The average temperature of each buffer zone was estimated, and the buffer zone with the peak mean temperature is selected as the UCI scale. Regression analysis was employed to determine the correlation between UCI intensity and a buffer distance. UCI Intensity=Tbuffer zone\rFT,=�E .=GA 4AOANRKEN@EOP=J?A KB �QBBAN VKJA BNKI ,=�E .=GA $KQJ@=NU (7) Where Tbuffer zone= the surface temperature at buffer zone and T,=�E .=GA 4AOANRKEN= the surface temperature at Jabi Lake Reservoir. IV. Results and Discussion a) Landuse/Landcover Dynamics in the Study Area Fig. 2 depicts the landuse/landcover categories at Jabi Lake Reservoir and its environs for 2017. Five land use classes were identified and classified within the study area which includes water body, vegetation, rock outcrop, built-up and bare surface. It was shown that in the year 2017 in the area, bare surface covered the highest area with 607.33 sq.km while Jabi Lake Reservoir and other op

9 en water spaces cover approximately 1.32
en water spaces cover approximately 1.32 sq.km. The built-up had an area coverage of 281.47 sq.km, with the rock outcrop covering 114.33 sq.km respectively. 1 GlobalJournalofScienceFrontierResearch VolumeXIX Issue ersion IVIIYear 2019 41 (A)©2019 Global Journals Assessment of Urban Cooling Island Effects of Jabi Lake Reservoir, Abuja on its Surrounding Microclimate using Geospatial Techniques Fig. 2: Landuse/Landcover categories at Jabi Lake Reservoir and its environs for year 2017b) Relationship between Normalized Vegetation Index (NDVI) and Buffer Distance from Jabi Lake Boundary Fig. 3 depicts the NDVI distribution at Jabi Lake Reservoir and its environs. It was observed that the highest NDVI value is 0.45 while the lowest value is –0.11. The built-up areas and Jabi Lake Reservoir exhibited negative to near-zero NDVI values respectively while vegetation had NDVI values greater than or equal to 0.30. Fig. 5 shows that there exists a strong negative relationship between NDVI and buffer distances from the Lake boundary with correlation coefficient, R = -0.94. This showed that away from the Lake boundary, there is a rapid conversion of vegetal cover to non-vegetated surfaces such as the built-up and bare surfaces which is attributed to urbanization taking place in the area. Fig. 3: NDVI distribution at Jabi Lake Reservoir and its environs 1 GlobalJournalofScienceFrontierResearch VolumeXIX Issue ersion IVIIYear 2019 42 (A)©2019 Global Journals Assessment of Urban Cooling Island Effects of Jabi Lake Reservoir, Abuja on its Surrounding Microclimate using Geospatial Techniques Fig. 4: Normalized Difference Vegetation Index distribution at various buffer distancesFig. 5: Correlation between NDVI and buffer distances from the Lake boundary c) Surface Temperature Distribution Across Various Buffer Distances from Jabi Lake Boundary Fig. 7 shows the surface temperature distribution at Jabi Lake Reservoir and its environs across various buffer zones from the outer boundaries of the Lake. It was shown that Jabi Lake Reservoir recorded the lowest surface temperature with a mean value of 24.59°C. However, it was depicted that surface temperatures exhibited an increasing trend from 27.86°C at 50 m to peak mean value of 30.96°C at 500 m buffer zones respectively. 00.050.10.150

10 .20.25Jabi Lake Reservoir501001502002503
.20.25Jabi Lake Reservoir50100150200250300350400450500NDVIBuffer Zones in 50 m intervals NDVI NDVI = -0.0001(Buffer Distance) + 0.2065R² = 0.889300.050.10.150.20.250100200300400500600NDVIBuffer Distance (m) 1 GlobalJournalofScienceFrontierResearch VolumeXIX Issue ersion IVIIYear 2019 43 (A)©2019 Global Journals Assessment of Urban Cooling Island Effects of Jabi Lake Reservoir, Abuja on its Surrounding Microclimate using Geospatial Techniques Fig. 6: Surface temperature distribution at Jabi Lake Reservoir and its environsFig. 7: Surface temperature distribution at various buffer distances(Source: Landsat 8 OLI, 29/11/2017) d) Urban Cooling Effect Intensityand Its Correlation with buffer range at Jabi Lake Reservoir, Abuja Fig. 8 shows the UCI intensity distribution at various buffer distances. The UCI intensity values depict the impact of Jabi Lake Reservoir on its surrounding environs which were sectioned into different buffer zones from the Lake boundary (50m, 100m, 150m, 200m, 250m, 300m, 350m, 400m, 450m, and 500m). It was shown that the Lake had the highest effect on areas within the 50m buffer zone with an intensity value of 0.065°C/m. There were noticeable decreasing effects on areas within 100mbuffer zone (0.042°C/m), with the least effect on places within the 500m buffer zone (0.013°C/m). Fig. 9 shows the relationship between UCI intensity and buffer range at Jabi Lake Reservoir, Abuja. Regression analysis results depicted that UCI intensity had a strong negative relationship with buffer distances from the Jabi Lake boundary with correlation coefficient, R = -0.88 which implies that locations very close to Jabi Lake felt more cooling effect than areas further apart from the lake boundary. Jabi Lake Reservoir50100150200250300350400450500 LST (°C)24.5927.8628.7429.3529.7930.0830.2930.4730.6430.830.96 20222426283032LST (°C)LST across various buffer distances (m) 1 GlobalJournalofScienceFrontierResearch VolumeXIX Issue ersion IVIIYear 2019 44 (A)©2019 Global Journals Assessment of Urban Cooling Island Effects of Jabi Lake Reservoir, Abuja on its Surrounding Microclimate using Geospatial Techniques Fig. 8: UCI Intensity distribution at various buffer distances Fig. 9: The relationship between UCI intensity and buffer range at Jabi Lake Reservoir, Abuja Table 3: Descriptive Statistics of UCI In

11 dices UCI Scale (m) LST(°C) Temperature
dices UCI Scale (m) LST(°C) Temperature Difference (°C) UCI Intensity (°C/m) Max. 500 30.96 6.37 0.065 Min. 50 27.86 3.27 0.013 Avg. 275 &#x/MCI; 23;&#x/MCI; 23;4.84 0.024 SD 151.38 &#x/MCI; 28;&#x/MCI; 28;1.86 0.017 V. Conclusions This study has proved that urban cooling intensity of Jabi Lake has a direct effect on its surrounding developed built-up microclimate. The results obtained from this study show that urban water spaces are capable of reducing the high surface temperature of the surrounding built-up areas. The management and sustenance of urban water spaces are very critical in mitigating UHI in urban cities. Understanding the correlation between UCI intensity and buffer zones from the Jabi Lake boundary is very crucial for urban planners, environmental decision makers and Government Authorities to design and maintain water spaces within cities and its environs to mitigate UHI effects especially in a hot and humid tropical cities in Nigeria. The findings from this study have proved that urban water spaces such as Jabi Lake Reservoir can create UCI effects on Abuja microclimate. Moreover, other methods of data acquisition such as the use of ground-based air temperature sensors may be adopted for air temperature measurements to obtain more quantitative results which will serve as a yardstick to validating LSTs retrieved from Lands at 8 OLI/TIRS satellite imageries. Lastly, wind speed and wind direction prevalent within the study area may likely Jabi Lake Reservoir50100150200250300350400450500 UCI Intensity (°C/m)00.0650.0420.0320.0260.0230.0190.0170.0150.0140.013 00.010.020.030.040.050.060.07UCI Intensity (°C/m) UCI Intensity (°C/m) at different buffer zones UCI = -9E-05(Buffer Zone Distance) + 0.0526R² = 0.76950.0000.0100.0200.0300.0400.0500.0600.0700100200300400500600UCI Intensity (°C/m)Buffer Distance (m) 1 GlobalJournalofScienceFrontierResearch VolumeXIX Issue ersion IVIIYear 2019 45 (A)©2019 Global Journals Assessment of Urban Cooling Island Effects of Jabi Lake Reservoir, Abuja on its Surrounding Microclimate using Geospatial Techniques influence the cooling effect, and this should be the focus of future research. Acknowledgement The authors wish to acknowledge the United States Geological Survey (USGS) for the provision of data used for this study. Conflict of Interest We

12 wish to confirm that there are no known
wish to confirm that there are no known conflicts of interest associated with this publication and there has been no significant financial support for this work that could have influenced its outcome. References Références Referencias 1. Voogt, J. (2002). Urban Heat Island. In Munn, T. (ed.) Encyclopedia of Global Environmental Change, Vol. 3. Chichester: John Wiley and Sons. 2. H. Taha, H. Akbari, and A. Rosenfeld, “Heat island and oasis effects of vegetative canopies: Micro-meteorological field measurements,” Theoretical and Applied Climatology, vol. 44, pp. 123-138, March 1991. 3. V. T. Ca, T. Asaeda, and E. M. Abu, “Reductions in air conditioning energy caused by a nearby park,” Energy and Buildings, vol. 29, pp. 83-92, December 1998. 4. C. Rosenzweig, W. Solecki, and R. Slosberg, Mitigating New York City's Heat Island with Urban Forestry, Living Roofs and Light Surfaces, New York: New York State Energy Research and Development Authority, 2007. 5. Spronken-Smith, R.A.; Oke, T.R (1998). The thermal regime of urban parks in two cities with different summer climates. Int. J. Remote Sens. 19, 2085–2104. 6. Chang, C.R.; Li, M.H.; Chang, S.D (2007). A preliminary study on the local cool-island intensity of Taipei city parks. Landsc. Urban. Plan 2007, 80, 386–395. 7. Ekwe Michael Chibuike, Adedeji Oluwatola Ibukun, Ahmad Abbas, Joshua Jonah Kunda (2018). Assessment of green parks cooling effect on Abuja urban microclimate using geospatial techniques. Remote Sensing Applications: Society and Environment, 11, 11–21. 8. Zhang, X.; Zhong, T.; Feng, X.; Wang, K (2009). Estimation of the relationship between forest patches and urban land surface temperature with remote sensing. Int. J. Remote. Sens. 30, 2105–2118. 9. Cao, X.; Onishi, A.; Chen, J.; Imura, H (2010). Quantifying the cool island intensity of urban parks using ASTER and IKONOS data. Landsc. Urban Plan. 96, 224–231. 10. Edward, N., Liang, C., Yingna, W., Chao, Y., Ng, E., Chen, L., Yuan, C. (2012). A Study on the Cooling Effects of Greening in a High-density City: An Experience from Hong Kong. Building and Environment, 47, 256–271. doi:10.1016/j.buildenv. 2011.07.014 11. Armson, D., Stringer, P., & Ennos, A. R. (2012). The Effect of Tree Shade and Grass on Surface and Globe Temperatures in an Urban Area. Urban Forestry & Urban Greening, 11(3), 245–255.

13 doi:10.1016/j.ufug.2012.05.002 12. Macke
doi:10.1016/j.ufug.2012.05.002 12. Mackey, C. W., Lee, X., & Smith, R. B. (2012). Remotely Sensing the Cooling Effects of City Scale Efforts to Reduce Urban Heat Island. Building and Environment, 49, 348–358. doi:10.1016/j.buildenv. 2011.08.004 13. Gago, E. J., Roldan, J., Pacheco-Torres, R., & Ordóñez, J. (2013). The City and Urban Heat Islands: A Review of Strategies to Mitigate Adverse Effects. Renewable and Sustainable Energy Reviews, 25, 749–758. doi:10.1016/j.rser. 2013.05.057 14. I.A. Balogun and M.T. Daramola. The impact of urban green areas on the surface thermal environment of a tropical city: a case study of Ibadan, Nigeria. M.T. Spat. Inf. Res. (2018). https://doi.org/10.1007/s41324-018-0219-6. 15. R. Sun and L. Chen, “How can urban water bodies be designed for climate adaptation?” Landscape and Urban Planning, vol. 105, pp.27-33, March 2012. 16. P. Gober, A. Brazel, R. Quay, S. Myint, S. G. Clarke, A. Miller, and S. Rossi, “Using watered landsapes to manipulate urban heat island effects,” Journal of the American Planning Association, vol. 76, pp. -121, 2010. 17. E. A. Hathway and S. Sharples, “The interaction of rivers and urban form in mitigating the Urban Heat Island effect: A UK case study”. Building and Environment, vol. 58, pp. 14-22, December 2012. 18. Eleh, N. (2001). Abuja: the single most ambitious urban design project of the 20th century. Volume 5 of Architektur der Welt. University of Michigan: VDG, Verlag und Datenbank-fürGeisteswissenschaften publishers. pp 98. 19. Abumere, S.I. (1984). The future population of the Federal Capital Territory, Abuja. The Nigerian Journal of Economic and Social Studies, 26(3): 287-313.\ 20. WMO (2016). World weather information service: Official Fore-cast. Retrieved from http://world- weather.wmo.int/en/city.htmlcityId=324 on 05 March, 2016. 21. Touristlink.com (2013). "Abuja Nigeria Tourist Information". Retrieved 2013-08-30. 22. Alavipanah, S.K., Saradjian, M., Savaghebi, G.R., Komaki, C.B., Moghimi, E., Karimpur Reyhan, M. (2010). Land surface temperature in the yardang region of Lut desert (Iran) based on field 1 GlobalJournalofScienceFrontierResearch VolumeXIX Issue ersion IVIIYear 2019 46 (A)©2019 Global Journals Assessment of Urban Cooling Island Effects of Jabi Lake Reservoir, Abuja on its Surrounding Microclimate using Geospatial Te