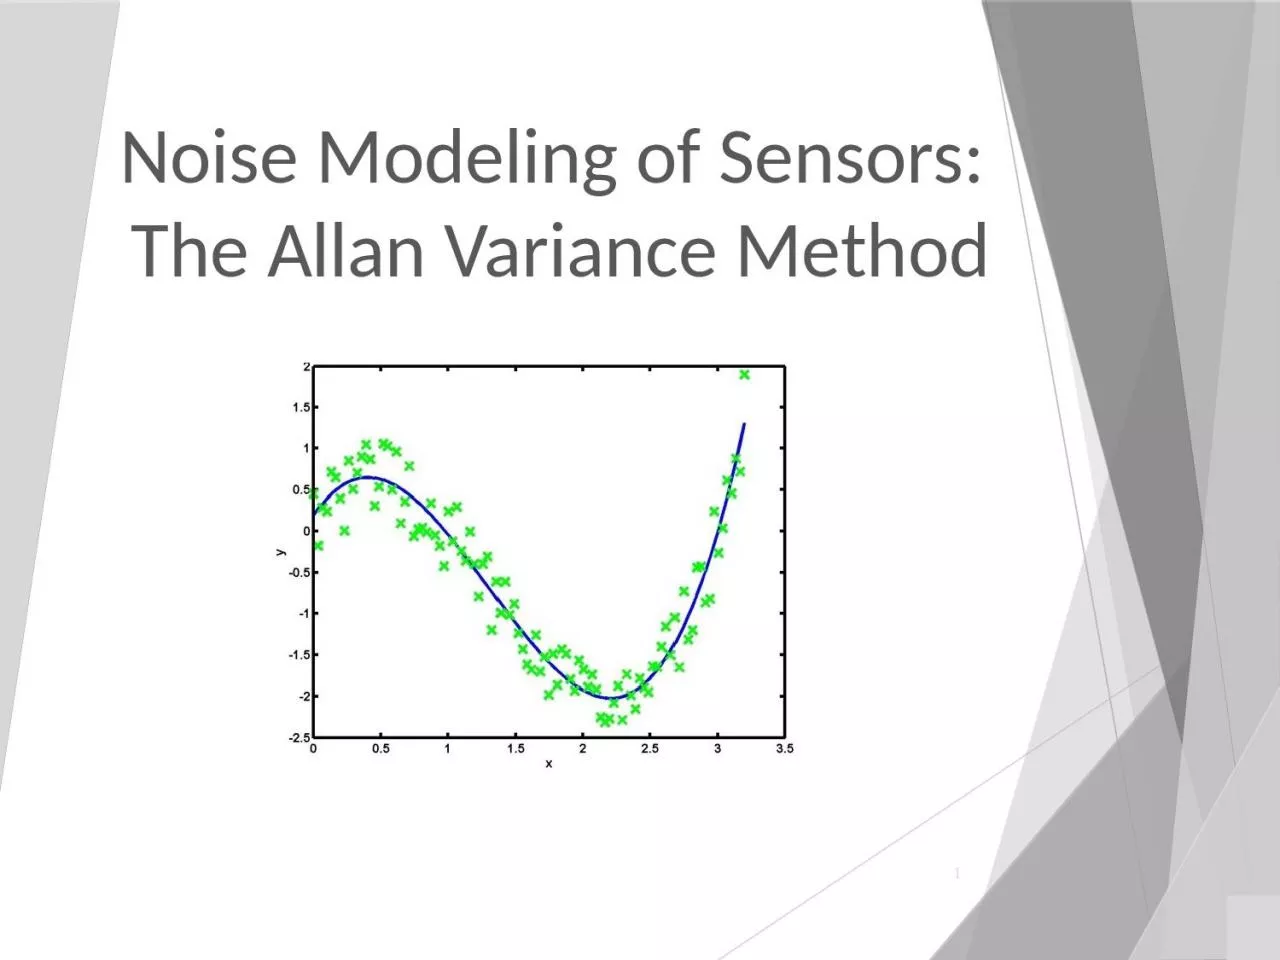
/
Noise Modeling of Sensors: Noise Modeling of Sensors:

Noise Modeling of Sensors: - PowerPoint Presentation

lydia
lydia . @lydia
Follow
68 views
Uploaded On 2023-11-08

Noise Modeling of Sensors: - PPT Presentation

The Allan Variance Method 0 You should be able to answer these questions PART I MOTIVATION What is noise What is noise modeling and why is it required PART II BASICS How is noise characterized ID: 1030665

allan noise analysis variance noise allan variance analysis plot sensor vavriance part random bias sensors time data model tracking

Share:

Link:

Embed:

Download Presentation from below link

Download Presentation The PPT/PDF document "Noise Modeling of Sensors:" is the property of its rightful owner. Permission is granted to download and print the materials on this web site for personal, non-commercial use only, and to display it on your personal computer provided you do not modify the materials and that you retain all copyright notices contained in the materials. By downloading content from our website, you accept the terms of this agreement.


Presentation Transcript

1. Noise Modeling of Sensors: The Allan Variance Method0

2. You should be able to answer these questions…PART I: MOTIVATIONWhat is noise?What is noise modeling and why is it required?PART II: BASICSHow is noise characterized?How is noise in sensors quantified?PART III: ALLAN VARIANCE ANALYSISWhat is Allan Variance?How can it be used to specify sensor characteristics?

3. Question…What do you think is meant by noise?MOTIVATION: WHAT IS NOISE?

4. Noise is context-dependentMOTIVATION: WHAT IS NOISE?MUSIC/SIGNALNOISEOR

5. Poles apart: What you want and what you get…MOTIVATION: WHAT IS NOISE?

6. A key assumption is that you know what you want!In signal processing, a “signal” is defined as anything that carries information. Music: a 1D signal, changes only with timeImages: a 2D signal, depends on 2 spatialMovies: a 3D signal, depends on 2 space and timeYou try…An x-ray?The orbital position of a satellite?An MRI scan?MOTIVATION: WHAT IS NOISE?

7. Historical insights into the nature of noise…Referred to as spontaneous fluctuationsTheoretical research in the early 20th centuryWork done by Einstein (1906), Schottky (1918), Ising (1925), Johnson and Nyquist (1928)Brownian Motion as a natural limit to all measuring processes; Barnes and Silverman (1934)Noise, Aldert van der Ziel; Prentice-Hall (1954)MOTIVATION: WHAT IS NOISE?

8. Early classification of noise was phenomenological“Phenomenological” = classification by sourceThermal noise: Random fluctuation of current carriers at equilibriumShot noise: Noise in low intensity images, also “drift” of current carriers in depletion regionFlicker noise: Slow fluctuations in conductivityMOTIVATION: WHAT IS NOISE? Random fluctuations of current carriersThermal noise Current carrier “drift” due to applied electric field in depletion region Shot noise Low frequency noise (vacuum tubes, heart beats, brain, stock markets)Flicker noise?

9. Not always clear what is noise or what is signalThe January 1, 1801 , an Italian monk, Giuseppe Piazzi (1746-1846), discovered a faint, nomadic object through his telescope in Palermo. Piazzi watched the object for 41 days but then fell ill, and shortly thereafter the wandering star star strayed into the halo of the Sun and was lost to observation.So limited was the scope of the measurements that the dean of the French astrophysical establishment, Pierre-Simon Laplace (1749-1827), declared that it simply could not be done.In Germany, the 24 year old German mathematician Carl Friedrich Gauss had considered that this type of problem – to determine a planet's orbit from a limited handful of observations – "commended itself to mathematicians by its difficulty and elegance.“Gauss discovered a method for computing the planet's orbit using only three of the original observations and successfully predicted where Ceres might be found.His paper on how he did this is considered the first example of regression, and is regarded as the birth of modern linear algebra. 

10. Question…What do you think is meant by noise modeling?MOTIVATION: NOISE MODELING

11. Noise models are functional representations of noise, often differential equationsExample: Bias instability or bias driftMOTIVATION: NOISE MODELING ParametersMATLAB code%% Bias driftb(1) = 0;Tc = 1000;N = 10000;for(i = 2:1:N) bdot(i) = (-1/Tc)*b(i-1) + 0.01*randn(1); b(i) = b(i-1) + bdot(i);endt = linspace(0,N,N);plot(t,b,'Linewidth',3);h = xlabel('Time (sec)');set(h,'Fontsize',13);h = ylabel('Noise magnitude (units)');set(h,'Fontsize',13);set(gca,'Fontsize',13);grid on;

12. Question…What do you think the potential applications for noise modeling could be?MOTIVATION: NOISE MODELING

13. Noise models can be usefulThink of the sensing processMOTIVATION: NOISE MODELINGEnvironment(Other phenomena)SensorOutput(Sensed Signal)Environment(Phenomenon)

14. Noise models are useful in signal filteringSignal filtering or recovery: E.g. Noise canceling hardware may utilize knowledge of noise models for signal filteringMOTIVATION: NOISE MODELINGEnvironment(Other phenomena)SensorOutput(Sensed Signal)Environment(Phenomenon)Perfect processProcess noisePerfect sensorSignal recoverySignal processingNoise due to extraneous signals

15. Noise models are useful in sensor selectionSensor design, selection and performance mapping: Identifying performance of various “virtual” sensors for a given sensing task requires knowledge of noise modelsMOTIVATION: NOISE MODELINGEnvironment(Other phenomena)Output(Sensed Signal)Environment(Phenomenon)Perfect processPerfect environs‘Virtual’ sensorsPerformance metricVarying degrees of measurement noiseSensor 1Sensor 2Sensor 3Sensor N

16. You should be able to answer these questions…PART I: MOTIVATIONWhat is noise?What is noise modeling and why is it required?PART II: BASICSHow is noise characterized?How is noise in sensors quantified?PART III: ALLAN VARIANCE ANALYSISWhat is Allan Variance?How can it be used to specify sensor characteristics?

17. Question…Can you think of some tools used to characterize noise?BASICS: NOISE CHARACTERIZATION

18. What is autocorrelation?As you change the data’s phase, how probable is correlation with the original data?Infinite Perfect CorrelationsOnly 1 Perfect Correlation

19. Noise characterization tools: AutocorrelationTime-domain representationLet be a stochastic variable: BASICS: NOISE CHARACTERIZATION

20. Noise characterization tools: AutocorrelationIf represents white noise,  BASICS: NOISE CHARACTERIZATIONDirac delta functionMATLAB code%% White noise autocorrelationclear allclcclose allN = 10000;w = randn(N,1);t = linspace(0,N,N);[c,lags] = xcorr(w,w);plot(lags,abs(c./max(c)),'Linewidth',2);

21. Noise characterization tools: PSDPower Spectral Density (PSD) is frequency-domain representation of noisePSD is the Fourier Transform of the autocorrelation function BASICS: NOISE CHARACTERIZATION

22. Noise characterization tools: PSDIf represents white noise,  BASICS: NOISE CHARACTERIZATIONMATLAB code%% Power Spectral densityN = 10000;w = randn(N,1);n = 256;W = fft(w,n);% Method 1Pww = W.*conj(W)/n;% Method 2Pww_welch = pwelch(w); % Method 3Pww_cov = pcov(w,3);% See Mathworks help for more details

23. Sensor characterization: Check the datasheet!BASICS: NOISE CHARACTERIZATION

24. You should be able to answer these questions…PART I: MOTIVATIONWhat is noise?What is noise modeling and why is it required?PART II: BASICSHow is noise characterized?How is noise in sensors quantified?PART III: ALLAN VARIANCE ANALYSISWhat is Allan Variance?How can it be used to specify sensor characteristics?

25. Make an educated guess…Which of the following technologies in the 1950s necessitated the development of a new measure of variance, i.e. the Allan variance?Solar-powered batteriesPrecision atomic clocksLeak-free ball point pensFlexible optical fibersALLAN VAVRIANCE ANALYSIS: ORIGINS

26. Origins: Frequency stability of atomic clocks1950s-1960s: Development of precise atomic clocks – issues pertaining to frequency stability arisePreliminary work: D W Allan, “Statistics of Atomic Frequency Standards”, Proceedings of the IEEE, 1966ALLAN VAVRIANCE ANALYSIS: ORIGINS

27. Allan VarianceAllan variance is defined as one half of the time average of the squares of the differences between successive readings of the frequency deviation sampled over the sampling period.NOTE:Allan variance analysis is always performed for zero input to the sensor. In this situation, any sensor output is due to noise arising from the sensor.See next slide to understand variables in the equationALLAN VAVRIANCE ANALYSIS: DEFINITION  

28. How is Allan Variance computed? Partition the data such that each section has ‘m’ samplesAllan Variance (σ2(m)) is a function of a parameter m. Compute the mean of data points in each partitionEvaluate difference of the means of adjacent sectionsSquare the value each differenceCompute the average of these squared valuesAllan Variance: σ2(m) = ½(Average Value) For example: Choose m = 20012345Ω1Ω2Ω3Ω4Ω5Ωk is the mean of points in kth partition(Ω2-Ω1)2(Ω3-Ω2)2(Ω4-Ω3)2(Ω5-Ω4)2<(Ωi+1-Ωi)2> = [(Ω2-Ω1)2 + (Ω2-Ω1)2 + (Ω2-Ω1)2 + (Ω2-Ω1)2] /4Also, known as the Expected value.Repeat for different values of mCompute the difference: Ωk - Ωk-1

29. Correlation time = 0.1 secondCorrelation time = 10 secondsCorrelation time = 1 secondCorrelation time = 0.02 secondsAllan Variance – Angle random walk Simulated white noiseALLAN VAVRIANCE ANALYSIS: DEFINITION

30. Allan Variance – Bias instabilityALLAN VAVRIANCE ANALYSIS: DEFINITIONSimulated bias instability What will the plot look like? What will the plot look like?

31. The Bias Instability Parameter, sbWhat is it?A measure of noise; small bias parameter means small noiseHow to get it?By inspection from autocorrelation plotORCalculate using least squares results

32. Angle Random Walk RegionCutoff Frequency ω0 = 1/ Bias Instability RegionHow do we find the autocorrelation?Step 1) Plot the Allan Variance and find the cutoff frequencyStep 2) Filter out the Angle Random WalkStep 3) Find the autocorrelation values and plot itMATLAB code% lowpass filter the data[b,a]=butter(2,wo); % 2nd order% butterworth filter under cutofffilterData = filtfilt(b,a,noisyData); % filter the dataMATLAB code% correlate the data and plot[c,lags] = xcorr(filterData,filterData);% run correlation functionplot(lags,abs(c./max(c)),'linewidth',2)% plot the normalized data

33. What is autocorrelation used for?Allan variance and autocorrelation analysis can be used to recover/predict sensor specifications such as noise parametersALLAN VAVRIANCE ANALYSIS: USAGE

34. How much data should we collect?Formula used: = admissible error in noise parametersN = number of data points required (amount of data to collect)K = number of data points per cluster ALLAN VAVRIANCE ANALYSIS: DEFINITION 1 year5 days

35. Allan Variance – Noise sourcesALLAN VAVRIANCE ANALYSIS: DEFINITION

36. Allan Variance – Noise sourcesNOTE:Allan variance works because different noise sources operate in different frequency spectra.ALLAN VAVRIANCE ANALYSIS: DEFINITION

37. Allan Variance Analysis: UsageI now know how to calculate Allan variance. So what can I do next?ALLAN VAVRIANCE ANALYSIS: USAGE

38. Simulating noisy data from our virtual sensor…Noise modelPrimary noise sources in inertial sensor gyroscopesAngle random walk with characterizing coefficient Bias instability with characterizing coefficient where     ALLAN VAVRIANCE ANALYSIS: USAGE 

39. MATLAB code%% Generating Random WalkcoeffN=0.05; %This is the N coefficientsample_num=1000; time = 0 : sample_num; x2 = zeros(sample_num+1,1); x2_max = zeros(sample_num+1,1); x = 0; for step = 1 : sample_num r = rand ( );% Take the step. if ( r <= 0.5 ) x = x - coeffN; else x = x + coeffN; end% Update the values x2(step+1) = x2(step+1) + x; end% Plot the results. plot ( time, x2, 'LineWidth', 2 );axis([0 1000 -2 2]);h = xlabel('Time (sec)');set(h,'Fontsize',13);h = ylabel('Noise magnitude (units)');set(h,'Fontsize',13);set(gca,'Fontsize',13);grid on;Random walk:A random process consisting of a sequence of discrete steps of fixed length (N=0.05rad/sec).Use white noise to determine when to ‘step’ (+ or – 0.05). Simulated random walk using MATLABSimulating random walk noise

40. A first-order Gauss-Markov process is typically used as an approximationHere is the correlation time which can be obtained from the auto-correlation plot and is unit white noise that drives the bias, and is the flicker noise parameter. Simulating bias instability drift

41. MATLAB code%% Bias driftb(1) = 0;Tc = 1000;N = 10000;for(i = 2:1:N) bdot(i) = (-1/Tc)*b(i-1) + 0.01*randn(1); b(i) = b(i-1) + bdot(i);endt = linspace(0,N,N);plot(t,b,'Linewidth',3);h = xlabel('Time (sec)');set(h,'Fontsize',13);h = ylabel('Noise magnitude (units)');set(h,'Fontsize',13);set(gca,'Fontsize',13);grid on;Simulated bias instability drift using MATLABSimulating bias instability drift

42. Simulated Sensor PitchTrue PitchNoise coefficients are indicators of sensor qualityRepresentative tactical-grade sensor Representative low-cost MEMS sensor Simulated Sensor PitchTrue PitchALLAN VAVRIANCE ANALYSIS: USAGE

43. Linear regression can be used to recover noise coefficientsAllan variance analysis was performed on simulated noiseBut how do we “fit” the noise model from Allan Variance?Angle Random WalkBias InstabilityALLAN VAVRIANCE ANALYSIS: USAGE 

44. As Gauss would say: do a regression analysis!We are interested in the representation of our data as a function of variables Assume a model for the given dataEg. y = mxArrange X values and Y values in column vectorx = (0:0.01:100)';m = 2.73;y = m*x + 10*randn(length(x),1);plot(x,y);xlabel('X')ylabel('Y')m = inv(x'*x)*x'*y;yfit = m*x;hold on;plot(x,yfit,'r','LineWidth', 2)hold offModelMathematical mischiefOne-step expression for m

45. What if we also have an intercept?Assume a model for the given dataEg. y = mx + cAppend a column of ones in X Eg. y = mx + 1*c x = (0:0.01:100)';m = 2.73;c = 10;y = m*x + c + 10*randn(length(x),1);plot(x,y);xlabel('X')ylabel('Y') X = [x ones(length(x),1)];cfs = inv(X'*X)*X'*yyfit = cfs(1)*x + cfs(2);hold on;plot(x,yfit,'r','LineWidth', 2)hold offcfs = 2.7417 9.7094  

46. What if the model was a polynomial?Assume a model for the given dataPut together matrix X with columns of ones, x x2 and x3 x = (0:0.01:100)';a = [10000 -300 20 -1]y = a(1) + a(2)*x ... + a(3)*x.^2 + a(4)*x.^3 ... + 10000*randn(length(x),1);plot(x,y);xlabel('X')ylabel('Y')hold on;X = [ones(length(x),1) x x.^2 x.^3];cfs = inv(X'*X)*X'*yyfit = cfs(1) + cfs(2)*x ... + cfs(3)*x.^2 + cfs(4)*x.^3;plot(x,yfit,'r','LineWidth', 2)hold off   

47. Application of Allan variance  +   +  The 4 term model (blue) gives nearly as much accuracy as the 5 term model (red) while the 3 term model (black) is insufficientKnow when to STOPBeing a log scale error down here doesn’t matter as much as error up here

48. Choosing the correct noise model After plotting the plot, decide which noise model to use – Which model best fits the obtained plot?Are all types of noise present in the signal?Try different models and see which fits the best and yields the minimum Pearson’s coefficient of correlation (). E.g. does fitting to the data give a higher , or does fitting ?Noise coefficients (N, B etc.) can be found:Directly from the plot, orFrom the coefficients of the weighted least squares fit ALLAN VAVRIANCE ANALYSIS: USAGE 

49. Identifying the noise coefficients Extrapolate lines to identify the coefficients OR perform weighted least squaresBoth approaches are equivalentQuantization (= fit coefficient) , = Angle random walk (= fit coefficient) , where = sampling rateBias instability (= fit coefficient = ) /0.664 = /0.664Rate random walk (= fit coefficient) = Rate ramp (= fit coefficient) =  ALLAN VAVRIANCE ANALYSIS: USAGE 

50. Research – Application of noise modelingOkay, so how is this stuff useful?ALLAN VAVRIANCE ANALYSIS: RESEARCH APPLICATION

51. Current Position EstimateTrue PositionTracking ErrorSome background – Terrain-based TrackingGPS SatelliteVehicle Tracking Performancewww.beaudaniels–illustration.com

52. Current Position EstimateTrue PositionTracking ErrorGPS-Free Vehicle Tracking PerformanceSome background – Terrain-based Tracking

53. Current Position EstimateTrue PositionPitch variationsGPS-Free Terrain-based Vehicle Tracking PerformanceSome background – Terrain-based Tracking

54. Current Position EstimateTrue PositionPre-recorded terrain database (Look-up table)GPS coordinatesPitch dataPitch variationsGPS-Free Terrain-based Vehicle Tracking PerformanceSome background – Terrain-based Tracking

55. Current Position EstimateTrue PositionTactical-grade sensorsGPS-Free Terrain-based Vehicle Tracking Performanceas a function of Inertial Sensor CharacteristicsLow-cost Sensors[1] Dean, A J; Langelaan; J W; Brennan, S N; “Improvements in Terrain-based Road Vehicle Localization by Initializing an Unscented Kalman Filter Using Particle Filters”, Proceedings of the American Control Conference 2010, Baltimore, MD, June 30-July 02, 2010Previous Research1Some background – Terrain-based Tracking

56. Mean tracking error and variance increase with increasing angle random walk noise in an approximately quadratic fashion.B=0.004B=0.006B=0.01B=0.002B=0.008B=0.001ALLAN VAVRIANCE ANALYSIS: RESEARCH APPLICATIONAngle Random Walk has significant impact…

57. Variance of tracking error varies approximately linearly with bias instability coefficientsN=0.01N=0.008N=0.006N=0.004N=0.002N=0.001N=0.01N=0.008N=0.006N=0.004N=0.002N=0.001ALLAN VAVRIANCE ANALYSIS: RESEARCH APPLICATIONBut Bias Instability does not

58. Sensors considered for analysisSensorApproximate Cost (in 2010 US dollars)Analog Devices ADIS163677000.0330.013Gladiator Technologies Landmark 103,0000.0140.007Gladiator Technologies Landmark 306,0000.010.003Honeywell HG170020,0000.00160.0003ALLAN VAVRIANCE ANALYSIS: RESEARCH APPLICATIONAccuracy and Precision increase with cost…

59. Higher tracking precision comes at an increasingly larger investmentTracking error variance is related to sensor cost by a power law: ALLAN VAVRIANCE ANALYSIS: RESEARCH APPLICATIONBut the law of diminishing returns kicks in…

60. [1]"IEEE Standard Specification Format Guide and Test Procedure for Single-Axis Interferometric Fiber Optic Gyros," IEEE Std. 952-1997 1998.[2]D. W. Allan, "Statistics of Atomic Frequency Standards," Proceedings of the IEEE, vol. 54, no. 2, pp. 221-230, 1966.[3]L.C. Ng and D. J. Pines, "Characterization of Ring Laser Gyro Performance using the Allan Variance Method," Journal of Guidance, vol. 20, no. 1, 1996.[4]N. El-Sheimy, H. Hou, and X. Niu, "Analysis and Modeling of Inertial Sensors Using Allan Variance," IEEE Transactions on Instrumentation and Measurement, vol. 57, no. 1, pp. 140-149, 2008.[5]S., Wang, J., Knight, N. Han, "Using Allan Variance to determine the Calibration Model of Inertial Sensors for GPS/INS Integration," in Proceedings of the 6th International Symposium on Mobile Mapping Technology, Sau Paulo, Brazil, 2009.[6]A. Van der Ziel, “Noise”, Prentice-Hall. 1954References

61. PART I: MOTIVATIONWhat is noise? What is noise modeling and why is it required? PART II: BASICSHow is noise characterized? How is noise in sensors quantified? PART III: ALLAN VARIANCE ANALYSISWhat is Allan Variance? How can it be used to specify sensor characteristics? You should be able to answer these questions…

62. PART I: MOTIVATIONWhat is noise? Noise is context-dependentYou should be able to answer these questions…

63. PART I: MOTIVATIONWhat is noise modeling and why is it required? Sensor design and selection; signal recoveryPART II: BASICSHow is noise characterized? How is noise in sensors quantified? PART III: ALLAN VARIANCE ANALYSISWhat is Allan Variance? How can it be used to specify sensor characteristics? You should be able to answer these questions…

64. PART II: BASICSHow is noise characterized? Autocorrelation and PSDYou should be able to answer these questions…

65. PART II: BASICSHow is noise in sensors quantified? Check datasheets for specsYou should be able to answer these questions…

66. PART III: ALLAN VARIANCE ANALYSISWhat is Allan Variance? Time-averaged statistic for stability analysisYou should be able to answer these questions…

67. PART I: MOTIVATIONWhat is noise? Noise is context-dependentWhat is noise modeling and why is it required? Sensor design and selection; signal recoveryPART II: BASICSHow is noise characterized? Autocorrelation and PSDHow is noise in sensors quantified? Check datasheets for specsPART III: ALLAN VARIANCE ANALYSISWhat is Allan Variance? Time-averaged statistic for stability analysisHow can it be used to specify sensor characteristics? Identify noise coefficients from plot You should be able to answer these questions…