/
dV / dt   Accelerating the Rate of Progress towards Extreme Scale Collaborative Science dV / dt   Accelerating the Rate of Progress towards Extreme Scale Collaborative Science

dV / dt Accelerating the Rate of Progress towards Extreme Scale Collaborative Science - PowerPoint Presentation

mackenzie
mackenzie . @mackenzie
Follow
27 views
Uploaded On 2024-02-09

dV / dt Accelerating the Rate of Progress towards Extreme Scale Collaborative Science - PPT Presentation

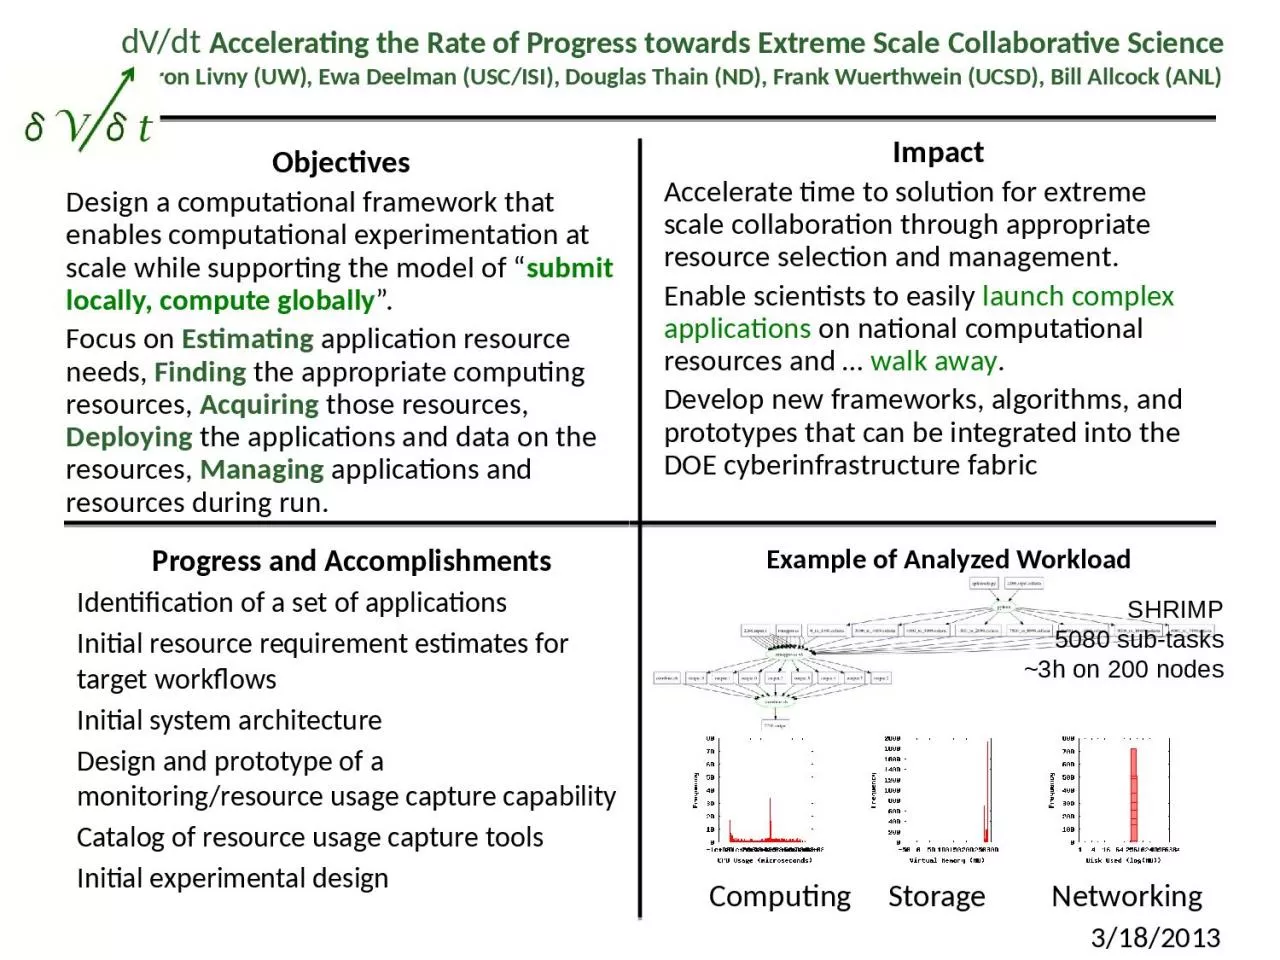
Miron Livny UW Ewa Deelman USCISI Douglas Thain ND Frank Wuerthwein UCSD Bill Allcock ANL Impact Accelerate time to solution for extreme scale collaboration through appropriate resource selection and management ID: 1046146

system resources workflow resource resources system resource workflow tasks applications cpu computing data task number makeflow application process framework

Share:

Link:

Embed:

Download Presentation from below link

Download Presentation The PPT/PDF document "dV / dt Accelerating the Rate of Progr..." is the property of its rightful owner. Permission is granted to download and print the materials on this web site for personal, non-commercial use only, and to display it on your personal computer provided you do not modify the materials and that you retain all copyright notices contained in the materials. By downloading content from our website, you accept the terms of this agreement.


Presentation Transcript

1. dV/dt Accelerating the Rate of Progress towards Extreme Scale Collaborative ScienceMiron Livny (UW), Ewa Deelman (USC/ISI), Douglas Thain (ND), Frank Wuerthwein (UCSD), Bill Allcock (ANL)ImpactAccelerate time to solution for extreme scale collaboration through appropriate resource selection and management.Enable scientists to easily launch complex applications on national computational resources and … walk away.Develop new frameworks, algorithms, and prototypes that can be integrated into the DOE cyberinfrastructure fabricProgress and AccomplishmentsIdentification of a set of applicationsInitial resource requirement estimates for target workflowsInitial system architectureDesign and prototype of a monitoring/resource usage capture capabilityCatalog of resource usage capture toolsInitial experimental design3/18/2013ObjectivesDesign a computational framework that enables computational experimentation at scale while supporting the model of “submit locally, compute globally”.Focus on Estimating application resource needs, Finding the appropriate computing resources, Acquiring those resources, Deploying the applications and data on the resources, Managing applications and resources during run.SHRIMP5080 sub-tasks~3h on 200 nodesExample of Analyzed Workload Computing Storage Networking

2. ThesisResearchers band together into dynamic collaborations and employ a number of applications, software tools, data sources, and instrumentsThey have access to a growing variety of processing, storage and networking resources Goal: “make it easier for scientists to conduct large-scale computational tasks that use the power of computing resources they do not own to process data they did not collect with applications they did not develop”

3. Challenges todayEstimate the application resource needsFinding the appropriate computing resourcesAcquiring those resourcesDeploying the applications and data on the resourcesManaging applications and resources during runMake sure the application actually finishes successfully!

4. ApproachA planning framework that covers the entire spectrum of computing resources—processing, storage, networking, and softwareThe framework that encompass the five phases of collaborative computing—estimate, find, acquire, deploy, and use

5. Experimental FoundationReal-world applicationsState of the art computing capabilities—Argonne Leadership Computing Facility and Open Science GridCampus resources at ND, UCSD and UW Commercial cloud servicesExperimentation from the point of view of a collaboration member: “submit locally and compute globally” Pay attention to the cost involved in acquiring the resources and the human effort involved in software and data deployment and application management

6. B1B2B3A1A2A3FFFFFFFFFRegular GraphsIrregular GraphsA1B237564CDE8910ADynamic Workloadswhile( more work to do) { foreach work unit { t = create_task(); submit_task(t); } t = wait_for_task(); process_result(t);}Static WorkloadsConcurrent WorkloadsApplication Characterization

7. Portal Generated Workflows/ use Makeflow WMS7BLAST (Small)17 sub-tasks~4h on 17 nodesBWA825 sub-tasks~27m on 100 nodes SHRIMP5080 sub-tasks~3h on 200 nodes

8. Periodograms: generate an atlasof extra-solar planetsFind extra-solar planets byWobbles in radial velocity of star, orDips in star’s intensityPlanetStarLight CurveTimeBrightness210k light-curves released in July 2010Apply 3 algorithms to each curve3 different parameter sets210K input, 630K output files1 super-workflow40 sub-workflows~5,000 tasks per sub-workflow210K tasks totalPegasus managed workflows

9. CyberShake PSHA Workflow239 WorkflowsEach site in the input map corresponds to one workflowEach workflow has:820,000 tasksDescriptionBuilders ask seismologists: “What will the peak ground motion be at my new building in the next 50 years?” Seismologists answer this question using Probabilistic Seismic Hazard Analysis (PSHA)Southern California Earthquake CenterMPI codes ~ 12,000 CPU hours, Post Processing 2,000 CPU hoursData footprint ~ 800GBPegasus managed workflowsWorkflow Ensembles

10. Plans Identify key, challenging applicationsDevelop a framework that allows to characterize the application needs, the resource availability, and plan for their use Main threads of research:Overall planning (dynamic)Storage and data management Network management CPU/Core management

11. System EntitiesWF instance: the workflow that a user submits, has information about computations do be done and their data dependencies (WF system-specific)WF structure—abstract representation of the workflow (WF system-independent)Provisioning profile—resources needed by WF tasksProvisioning plan– resources to be provisioned over timeSchedule– mapping of tasks to resources

12. System ComponentsWorkflow System(Makeflow, Pegasus)Workflow ExecutorWF Instances

13. System ComponentsEnsemble ManagerResource ProvisionerWorkflow System(Makeflow, Pegasus)Workflow ExecutorProvisioning ProfileWF InstancesProvisioning planList of resources

14. System ComponentsEnsemble ManagerResource ProvisionerWorkflow System(Makeflow, Pegasus)Workflow ExecutorMonitoringModelingWF StructureProvisioning ProfileWF InstancesProvisioning planList of resourcesreprovisionTask infoRecord

15. System ComponentsEnsemble ManagerResource ProvisionerWorkflow System(Makeflow, Pegasus)Workflow ExecutorMonitoringModelingAnalysis and PlanningWF StructureProvisioning ProfileWF InstancesProvisioning planList of resourcesreprovisionTask infoRecord

16. System ComponentsEnsemble ManagerResource ProvisionerWorkflow System(Makeflow, Pegasus)Workflow ExecutorMonitoringModelingAnalysis and PlanningWF StructureProvisioning ProfileWF InstancesProvisioning planList of resourcesreprovisionTask infoRecord

17. Task Characterization/ExecutionUnderstand the resource needs of a taskEstablish expected values and limits for task resource consumptionLaunch tasks on the correct resourcesMonitor task execution and resource consumption, interrupt tasks that reach limitsPossibly re-launch task on different resources

18. Modeling of tasksexit_type / , exitcode, “signalled”, “limit” signal -- The number of the signal that terminated the process. limits_exceeded Comma-separated list of all the resource limits that were exceeded by the processmax_concurrent_processes--The maximum number of processes that ran concurrently.cpu_time The total CPU time of the process (utime+stime).wall_timevirtual_memory/resident_memorybytes_read/bytes_writtenValues that only Appear if A Working Directory is Specifiedworkdir_number_files_dirs-- The peak value of the number of files and directories in the working directory.workdir_footprint---The peak value of the size of all files and directories in the working directory.

19. Data Collection and ModelingRAM: 50MDisk: 1G CPU: 4 CmonitortaskworkflowACFtypmaxminPRAMBA BDECDEFScheduleWorkflow StructureWorkflow ProfileTask ProfileRecords FromMany TasksTask RecordRAM: 50MDisk: 1G CPU: 4 CRAM: 50MDisk: 1G CPU: 4 CRAM: 50MDisk: 1G CPU: 4 C

20. Static Workflow Monitoringflow specificationresource controlflow executionmakeflow -T: condorout.bsrc.b src.c cmd2

21. Static Workflow Monitoringflow specificationresource controlflow executionmakeflow -T: condor -M: limitsout.b log-rule-002 summary-002src.b src.c cmd2 mon limits

22. Triggering Alarmslimits specificationsummary with alarmglobal: limits filelocal: per makeflow rule

23. MonitorSummariesSnapshotEventsgetrusage and timesReading /proc and measuring disk at given intervals.Linker wrapper to libcAvailable only at the end of a process.Blind while waiting for next interval.Fragile to modifications of the environment, no statically linked processes.IndirectDirectMonitor how the world changes while the process tree is alive.Monitor what functions, and with which arguments the process tree is calling.

24. Resources Monitored Per TreeCPU (user + kernel times)Size of the tree (number of processes)Open filesMemory (virtual memory)Input-Output (characters read and written)Disk (size in bytes of files, and count of virtual nodes)Think of resources whose value is as invariant as possible from the load of the machine (except disk, for alarms).

25. Exampleshttp://www3.nd.edu/~ccl/workflows/Blast: 10 workers, 3.5 hours, 70 jobsShrimp: 350 workers, 2.9 hours, 5080 jobsBWA: 100 workers, 0.5 hours, 825 jobsVisualization: Casey Robinson, Kyle Mulholland

26. Implementationrmonitor(log, summary)execvlibrmonitor.so(fork, wait, chdir, open)ld_preloadudp/procreaddisksfts, statfssummarysnapshoteventslibcgetrusagelibc

27. Experimental designCharacterize a set of applications, run large number of instancesDesign synthetic applications with a desired behavior (CPU consumption, Mem, I/O)Run a large number of instancesModel task and application behaviorSee if the model matches the inputSee if the system responds appropriatelyExperimental platform:ND/Center for Research Computing, UW, USC (Year 1)Open Science Grid (with glideinWMS) (Year 2)Argonne Leadership Computing Facility (Year 2)Clouds (Year 3)

28. ConclusionsdV/dt will develop a planning framework that:Starts with an unknown applicationCharacterizes it and manages executionProvisions resources/monitor execution/adaptsExperiment at scaleAvoids disasterWe will develop solutions that can be used in other projectsprovide methodologies, algorithms, and prototype solutionsInitial focus on application resource characterization and monitoringWe are seeking interesting applications for characterizationhttps://sites.google.com/site/acceleratingexascale/