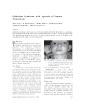
/
Journal Vol 24 No8 pp 777781 1992 High Pressure Dilatometry of Journal Vol 24 No8 pp 777781 1992 High Pressure Dilatometry of

Journal Vol 24 No8 pp 777781 1992 High Pressure Dilatometry of - PDF document

maisie
maisie . @maisie
Follow
344 views
Uploaded On 2021-06-10

Journal Vol 24 No8 pp 777781 1992 High Pressure Dilatometry of - PPT Presentation

Polymer MATSUSHIGE and Munehisa YASUNIWA Department of Applied Physics Faculty of Science Fukuoka University Jonanku Fukuoka 8141 Japan Department of Applied Science Faculty of Engi ID: 838964

high pressure tr4 tr3 pressure high tr3 tr4 mpa change c20f volume process phase figure transition dynamic x0000 sample

Share:

Link:

Embed:

Download Presentation from below link

Download Pdf The PPT/PDF document "Journal Vol 24 No8 pp 777781 1992 High P..." is the property of its rightful owner. Permission is granted to download and print the materials on this web site for personal, non-commercial use only, and to display it on your personal computer provided you do not modify the materials and that you retain all copyright notices contained in the materials. By downloading content from our website, you accept the terms of this agreement.


Presentation Transcript

1 Polymer Journal, Vol. 24, No.8, pp 777-
Polymer Journal, Vol. 24, No.8, pp 777-781 (1992) High Pressure Dilatometry of n-Perfluoroeicosane Shinsuke TsuBAKIHARA, Kenichi HIGAsm, *, t Seiji T AKI, * Kazumi MATSUSHIGE,* and Munehisa YASUNIWA Department of Applied Physics, Faculty of Science, Fukuoka University, Jonan-ku, Fukuoka 814-{)1, Japan *Department of Applied Science, Faculty of Engineering, Kyushu University, Higashi-ku, Fukuoka 812, Japan (Received January 31, 1992) ABSTRACT: The (C20F 42) was carried out in the isothermal compressing process at 296 K and isobaric heating processes at various pressures up to 500 MPa. The dilatometry in the isothermal compressing process at 296 K showed the possibility that there are two second-order transition points at about 200 and 250 MPa, which could not be detected by high pressure differential l'iH and entropy one !'iS at two crystal- transitions under high pressure, denoted by Tr3 and Tr4, were calculated based on Clausius-Clapeyron's equation. The entropy change per one mole of repeating units, l'iSc, in the pressure region between 400 and 500MPa is 0.7-0.9JK-1mol-1 at Tr3 and Tr4, respectively, which indicate that moderate rotation of molecular chains starts at Tr3 and then becomes more active at Tr4 in the heating process under high pressure. KEY WORDS n-Perfiuoroeicosane I C20F 42 I Polytetrafiuoroethylene I n-Alkane I Rotator Phase I Phase Transition I Dynamic Disorder I High Pressure I I In the previous work, 1 the authors studied the phase transitions of n-perfluoroalkanes, i.e., polytetrafluoroethylene (PTFE) oligomers by high pressure differential thermal analysis (DT A) and first determined their phase diagrams. It was shown that n-perfluoro­eicosane (C20F 42) and n-perfluorotetracosane (C24F 50) have interesting phase diagrams quite different from that of PTFE. Tr4 occurs �(- �Tr3- �Tr4-) �(- �Tr5- ). Above about 400 MPa, only �- �Tr3- �Tr4- occurs. The phase diagram of C24F 50 is also similar to that of C20F 42 except the differences of transition points. The phase diagram of C20F 42 is shown in Figure 1. Below about 300 MPa, a sequence of 300 and 400 MPa, there are two cases of crystal-crystal transitions, one case in which a pair of Tr3 and Although the phase diagrams of these n-perfluoroalkanes were determined by high pressure DT A, the thermodynamic parame­ters at transitions under high pressure, such as volume change enthalpy one AH, and entropy one AS could not be obtained only from the data. These thermodynamic pa­rameters give information as to the type of dynamic disorder2 activated at the transitions in the heating process. In this work, C20F 42 t Present

2 address: Plastic Engineering Section, E
address: Plastic Engineering Section, Engineering Department No.3, Nissan Motor Co., Ltd., Niihamacho, Kandamachi, Fukuoka 800-03, Japan. 777 S. TSUBAKIHARA et a/. 500 Liquid g 400 �:: -.; Q; c. 300 f- Solid 2 3 4 5 Pressure (X10'MPa) Figure 1. Phase diagram of C20F 42, determined by high pressure DT A. 1 The dotted lines I and 2 show paths along which dilatometry was carried out. whose detailed mechanism of phase transition had been clarified at atmospheric pressure, 3 was studied by high pressure dilatometry. Its thermodynamic parameters at Tr3 and Tr4 were determined. From these results, the dynamic disorders activated at these transitions are discussed. EXPERIMENTAL C20F 42 used in this work was the same high pure sample as that used for high pressure DT A. 1 Its high pressure dilatometry was carried out using high pressure dilatometry apparatus described in detail elsewhere. 4 Figure 2 shows the schematic diagram of its main parts. The total volume change of the sample and liquid medium encapsulated together in the bellows cell, with temperature and pressure, was converted to the displace­ment of the steel wire and detected by the differential transformer. The hydrostatic pres­sure in the high pressure vessels was measured with a calibrated manganin manometer with an accuracy of ± 1 MPa, and the temperature of the sample was monitored with an Alumei-Chromel thermocouple placed near the cell. The sample of C20F 42 was melt-crystallized from the original one at atmospheric pressure and annealed at a temperature close to its melting point (437 K) in a vacuum in order to 778 Figure 2. Schema tic picture of a high pressure dila­tometry apparatus. I, high pressure pipe; 2, sheathed Alumel-Chromel thermocouple; 3, sheathed heater; 4, supporting part; 5, liquid medium (silicone oil); 6, sample; 7, bellows cell; 8, steel wire; 9, high pressure vessel; 10, differential transformer. remove the air m crystal voids. By this annealing treatment, paths linking the voids to outer space around the crystals were made. The sample was set in the cell and the excess space including the crystal voids was filled with silicone oil (Toshiba TSF451-10, lOcSt) used as the liquid medium. The space around the cell and differential transformer in the high pressure vessels was also filled with the same silicone oil (pressure transmitting fluid). The total volume change of the sample and silicone oil in the cell was examined in the isothermal compressing process at 296 K (path 1 in Figure 1) and in the isobaric heating ones at various pressures (for example, path 2 in the same figure). The measurement below room temperature could not be carried out because the used high pressure vessel cannot endure high pressure in the

3 low temperature range. The volume chang
low temperature range. The volume change of the sample in each process was obtained later by deducting that of the silicone oil in the bellows cell from the total one. The volume change of the silicone oil in the process had been previously obtained from the measurement as to the silicone oil alone in the same process. The specific volume of C20F 42 at 296 K and Polym. J., Vol. 24, No. 8, 1992 High Pressure Dilatometry of n-Perfluoroeicosane atmospheric pressure was calculated using lattice parameters obtained by X-ray measure­ment on the assumption that the purity of the sample was 100%. RESULTS AND DISCUSSION Figure 3 shows the pressure change of the specific volume of C20F 42, measured in the isothermal compressing process at 296 K (path 1 in Figure 1). It was measured at 20 MPa intervals because its continuous change with pressure could not be done in the used apparatus. The specific volume and compres­sibility at 296 K and atmospheric pressure are 0.4752cm3g-1 and 2.125x10⁻¹⁰Pa-1, re­spectively. The line expressing the pressure change of specific volume bends at about 200 and ' C) e 30.45 "' E :J 0 � ,g 0.40 ·;:; "' c. 296K ' 2 3 4 Pressure (X 1 O'MPa) Figure 3. Pressure change of the specific volume of C20F 42 at 296 K. It was measured at 20 MPa intervals in the isothermal compressing process along path I in Figure I. I E 3 '" E :J 0 � 0.40 u ;;:: ·;:; '" c. 300 Tr3 Tr4 350 Temperature (K) 450MPa 400 Figure 4. Temperature change of the specific volume of C20F 42 at 450 MPa. It was measured continuously at a very slow rate in the isobaric heating process along path 2 in Figure I. Polym. 1., Vol. 24, No. 8, 1992 250 MPa. Compressibility becomes very small value at about 200 MPa and increases again at about 250 MPa with pressure. This indicates the possibility that second order transitions which could not be detected by high pressure DT A 1 occur at these pressures. The authors carried out high pressure X-ray measurement on the same sample, and the paper that reports the results is in preparation. 5 In this measure­ment, two second-order transition points were also recognized in the same pressure region. At 380 MPa that corresponds to Tr3, the specific volume decreases discontinuously. On the other hand, no change occurs at 344 MPa that corresponds to Tr5, suggesting that in this isothermal compressing process, Tr3 occurs but Tr5 does not. Figure 4 shows the temperature change of the specific volume of C20F 42, measured in the isobaric heating process at 450 MPa (path 2 in Figure 1 ). This measurement was carried out continuously at a very slow rate. The specific volume increases with temperature and changes discontinuously at

4 two temperatures which correspond to Tr
two temperatures which correspond to Tr3 and Tr4. The volume change at Tr3 is much larger than that at Tr4. The coefficient of cubical expansion decreases with temperature as 9.22 x 10⁻⁴ K-1 below Tr3, 4.83 x 10⁻⁴ K-1 between Tr3 and Tr4, and 3.50 X 10⁻⁴ K -1 above Tr4. Similar dilatometric measurements in the isobaric heating processes were conducted at various pressures. In Table I, the thermo­dynamic parameters of C20F 42 at Tr3 and Tr4 for various pressures are given. The end temperatures of the volume changes due to these transitions correspond to the peak temperatures of the DT A curve in the same process, used as the transition points in previous work. 1 Therefore, the transition points, Tin Table I, were obtained from the end temperatures. The value of dT/dP was obtained from the gradient of the transition lines of Tr3 and Tr4 in Figure I. The enthalpy change AH and entropy one AS, which are values per one mole of molecules, were 779 S. TSUBAKIHARA eta/. Table I. Thermodynamic parameters of C20F 42 at Tr3 and Tr4 Tr3 p T dT/dP MPa K x I0-7KPa-1 xl0-2cm3g-1 kJmo1-1 JK-1mo1-1 JK-1mo1-1 425 314 4.11 1.190 9.42 30.1 1.51 450 324 3.98 1.183 9.98 30.8 1.54 500 343 3.71 1.270 12.18 35.5 1.78 Tr4 p T dT/dP MPa K x I0-7KPa-1 x I0-2cm3g-1 kJmo1-1 JK-1mo1-1 JK-1mo1-1 290 300 320 350 400 450 500 317 323 333 348 371 391 408 5.40 0.317 5.29 0.350 5.09 0.476 4.79 0.492 4.29 0.580 3.78 0.577 3.28 0.571 calculated from T, dT/dP, and Llv based on Clausius-Clapeyron's equation, dT/dP= TLlv/LlH=Llv/LlS LiSe is the entropy change per one mole of repeating units (CF 2), calculated from LiSe= LlS/20 based on the assumption that two end groups contribute to LiS to the same degree as other repeating units. At each pressure above about 400 MPa, the changes of all thermo­dynamic parameters at Tr3 are larger than those at Tr4. The change of LlH at Tr4 increases with pressure. From the values of entropy change in Table I, information on types of dynamic disorders activated at Tr3 and Tr4 can be obtained by analogy with n-alkanes in which similar types of disorders are expected. It is well known that n-alkanes transit to rotator phase prior to melting, where the rotation of molecular chains around the chain axes occurs. In addition, two other types of dynamic disorders, 180°­ rotational jump and flip-flop screw jump were reported for n-tritriacontane (C33H68) by 780 1.93 6.1 0.31 2.21 6.9 0.35 3.23 9.7 0.49 3.71 10.7 0.54 5.20 14.0 0.70 6.19 15.8 0.79 7.38 18.1 0.91 Strobl et al. 6 The same types of dynamic disorders were confirmed to occur in other odd-numbered n-alkanes. 7 For transition to the rotator phase, the transition point and enthalpy chan

5 ge of each n-alkane were summarized by B
ge of each n-alkane were summarized by Broadhurst. 8 From these values, the authors calculated the entropy change for the transition based on LlS=LlH/T and LlSc=LlS/n, where n is the number of carbon atoms. According to the results, LlH and LlS increase with n, but LiSe does not depend on n for odd and even­numbered n-alkanes. LlSc is 2.2-3.3 JK -l mol-1 and 3. 7-4.1 JK -l mol-1 for odd and even-numbered n-alkanes, respectively. The value for odd-numbered ones was also confirmed by detailed thermal analysis as to n-alkanes, carried out recently by Takamizawa et al. 7 They reported that the values of LlS at transitions accompanying the other types of dynamic disorders are very small compared with that at the transition to the rotator phase and independent on the number of carbon atoms. Po1ym. J., Vol. 24, No.8, 1992 High Pressure Dilatometry of n-Perfiuoroeicosane Entropy changes of similar types of dynamic disorders are expected to be comparable as Wunderlich showed for three types of dis­orders, i.e., positional, orientational, and conformational ones. 9 Therefore, the types of disorders of C20F 42 at Tr3 and Tr4 can be supposed by a comparison of entropy changes with those of n-alkanes. ASc at Tr3 in C20F 42, 1.5-1.8 JK -l mol-1 between 400 and 500 MPa, is somewhat smaller than that at the transition to the rotator phase in n-alkanes. ASc at Tr4 in this pressure region, 0.7-0.9 JK-1 mol-1, is about half that at Tr3, and the sum of ASc values at Tr3 and Tr4, 2.2-2.7 JK-1 mol-1, is comparable with that at the transition to the rotator phase in odd­numbered n-alkanes. From these facts, it is supposed that the rotation of molecular chains is activated to some degree at Tr3, and the rotation becomes more active at Tr4. In fact, the results of high pressure X-ray measurement Polym. J., Vol. 24, No.8, 1992 support this supposition as to the rotational dynamic disorders activated at Tr3 and Tr4 in the heating process under high pressure. 5 REFERENCES I. S. Tsubakihara and M. Yasuniwa, Polym. J., 24,421 (1992). 2. B. Wunderlich, M. Moller, J. Grebowicz, and H. Baur, "Conformational Motion and Disorder in Low and High Molecular Mass Crystals," Adv. Polym. Sci., 87, Springer-Verlag, Berlin, 1988, Chapter I. 3. H. Schwickert, Doctoral Thesis, Universitat Mainz, 1984. 4. S. Taki, T. Takemura, and K. Matsushige, Jpn. J. Appl. Phys., 30, 888 (1991). 5. S. Tsubakihara and M. Yasuniwa, in preparation. 6. G. R. Strobl, J. Polym. Sci., Polym. Symp., 59, 121 (1977). 7. K. Takamizawa, Netsu Sokutei, 16(3), 112 (1989). 8. M. G. Broadhurst, J. Research Nat!. Bur. Standards, Sect. A, 66, 241 (1962). 9. B. Wunderlich, "Macromolecular Physics," Vol. 3, Academic Press, New York, N.Y., 1980, Chapter 8. 78