/
Competition Photo  of hyenas and lioness at a carcass from Competition Photo  of hyenas and lioness at a carcass from

Competition Photo of hyenas and lioness at a carcass from - PowerPoint Presentation

marina-yarberry
marina-yarberry . @marina-yarberry
Follow
345 views
Uploaded On 2019-11-05

Competition Photo of hyenas and lioness at a carcass from - PPT Presentation

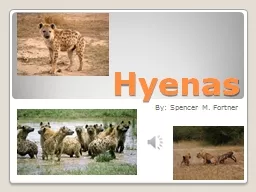
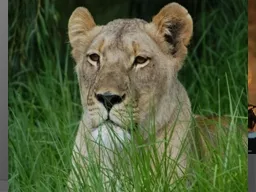
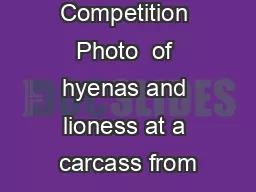
Competition Photo of hyenas and lioness at a carcass from https wwwflickrcomphotosdavidbygott4046054583 A B Competition Influence of species A Influence of Species B positive 0 neutralnull ID: 763624

competition species lotka volterra species competition volterra lotka equilibrium models population amp intrasp intersp tilman model trajectories phenomenological effects

Share:

Link:

Embed:

Download Presentation from below link

Download Presentation The PPT/PDF document "Competition Photo of hyenas and lioness..." is the property of its rightful owner. Permission is granted to download and print the materials on this web site for personal, non-commercial use only, and to display it on your personal computer provided you do not modify the materials and that you retain all copyright notices contained in the materials. By downloading content from our website, you accept the terms of this agreement.


Presentation Transcript

Competition Photo of hyenas and lioness at a carcass from https:// www.flickr.com/photos/davidbygott/4046054583

A B Competition - - Influence of species A Influence of Species B + (positive) 0 (neutral/null) - (negative) A B Amensalism 0 - A B Antagonism (Predation/Parasitism) + - A B Commensalism + 0 A B Neutralism (No interaction) 0 0 A B Commensalism 0 + A B Mutualism + + A B Amensalism - 0 A B Antagonism (Predation/Parasitism) - + - 0 + Redrawn from Abrahamson (1989); Morin (1999, pg. 21) Pairwise Species Interactions

Intra-specific vs. Inter-specific Competition Photo of hyenas and lioness at a carcass from https:// www.flickr.com/photos/davidbygott/4046054583 Interaction between individuals in which each is harmed by their shared use of a limiting resource (which can be consumed or depleted) for growth, survival, or reproduction

Intra-specific vs. Inter-specific Competition Cain, Bowman & Hacker (2014), Fig. 12.11, after Gause (1934); photomicrographs from Wikimedia Commons “ Complete competitors cannot coexist .” (Hardin 1960) Paramecium aurelia Paramecium caudatum

Intra-specific vs. Inter-specific Competition Resource partitioning – differences in use of limiting resources – can allow species to coexist Cain, Bowman & Hacker (2014), Fig. 12.11, after Gause (1934) P. aurelia & P. caudatum ate mostly floating bacteria; P. bursaria ate mostly yeast cells on the bottoms of the tubes

Alfred Lotka & Vito Volterra Lotka – Volterra Phenomenological Competition Models Photo of Lotka from http://blog.globe-expert.info; photo of Volterra from Wikimedia Commons (1860-1940) (1880-1949)

Logistic population growth model – growth rate is reduced by intraspecific competition: Species 1: dN1 /dt = r1N1[(K 1-N1)/K1] Species 2: dN2/dt = r2N2[(K2- N 2)/K2]Functions added to further reduce growth rate owing to interspecific competition : Species 1: dN1/ dt = r1N1 [(K1-N 1-f( N2))/K1] Species 2: dN2/dt = r2N2 [(K2-N2-f(N1))/K2] Lotka-Volterra Competition Equations: Lotka – Volterra Phenomenological Competition Models

Lotka-Volterra Competition Equations: The function ( f ) could take on many forms, e.g.: Species 1: dN1/dt = r1N1[(K 1 -N1-αN2)/K1] Species 2: dN2/dt = r2N2[(K2-N2-βN1 )/K 2] The competition coefficients α & β measure the per capita effect of one species on the population growth of the other, measured relative to the effect of intraspecific competition If α = 1, then per capita intraspecific effects = interspecific effects If α < 1, then intraspecific effects are more deleterious to Species 1 than interspecific effects If α > 1, then interspecific effects are more deleterious Lotka – Volterra Phenomenological Competition Models

This makes intuitive sense: The equilibrium for N 1 is the carrying capacity for Species 1 (K1) reduced by some amount owing to the presence of Species 2 (αN2) Find equilibrium solutions to the equations, i.e ., set dN/dt = 0: Species 1: N1 = K1 - αN2 Species 2: N2 = K2 - βN1 ^ ^ ^ ^ However, each species’ equilibrium depends on the equilibrium of the other species! So, by substitution… Species 1: N 1 = K 1 - α(K2 - βN1) Species 2: N2 = K2 - β(K1 - αN2) ^ ^ Lotka – Volterra Phenomenological Competition Models

These provide some insights into the conditions required for coexistence under the assumptions of the model The equations for equilibrium solutions become: Species 1: N 1 = [K1 - αK2] / [1 - αβ] Species 2: N2 = [ K2 - βK1] / [1 - αβ] ^ ^ E.g ., the product αβ must be < 1 for N to be > 0 for both species (a necessary condition for coexistence) But they do not provide much insight into the dynamics of competitive interactions, e.g., are the equilibrium points stable? Lotka – Volterra Phenomenological Competition Models

State-space graphs help to track population trajectories (and assess stability) predicted by models 4 time steps From Gotelli (2001) Lotka – Volterra Phenomenological Competition Models

State-space graphs help to track population trajectories (and assess stability) predicted by models Mapping state-space trajectories onto single population trajectories 4 time steps 4 time steps From Gotelli (2001) Lotka – Volterra Phenomenological Competition Models

Remember that equilibrium solutions require dN /dt = 0Species 1: N1 = K1 - αN 2 Isocline for Species 1 dN 1/dt = 0^ N 1 K 1 K 1 / α Therefore: When N 2 = 0, N 1 = K 1 When N 1 = 0, N2 = K1/α Lotka-Volterra Model N 2

Remember that equilibrium solutions require dN /dt = 0Species 2: N2 = K2 - βN 1 ^ N 1 N 2 K 2 / β K 2 Isocline for Species 2 dN 2 / dt = 0 Therefore: When N 1 = 0, N 2 = K 2 When N 2 = 0, N1 = K 2/β Lotka-Volterra Model

N 2 K 2 / β K 2 Plot the isoclines for 2 species together to examine population trajectories K 1 / α > K 2K1 > K2/ βFor species 1: K1 > K2α (intrasp. > intersp.)For species 2: K1β > K 2 (intersp. > intrasp.) K 1 K 1 / α = stable equilibrium Competitive exclusion of Species 2 by Species 1 N 1 Lotka-Volterra Model

N 2 K 2 / β K 1/ α Plot the isoclines for 2 species together to examine population trajectories K 2 > K 1 / αK2/β > K1For species 1: K2α > K1 (intersp. > intrasp.)For species 2: K2 > K1 β (intrasp. > intersp.) K 1 K 2 Competitive exclusion of Species 1 by Species 2 = stable equilibrium N 1 Lotka-Volterra Model

N 2 K 2 / β K 1 / α Plot the isoclines for 2 species together to examine population trajectories K 2 > K 1 /α K1 > K2/βFor species 1: K2α > K1 (intersp. > intrasp.)For species 2: K1 β > K2 (intersp. > intrasp.) K 1 K 2 Competitive exclusion with an unstable equilibrium = stable equilibrium = unstable equilibrium N 1 Lotka-Volterra Model

N 2 K 2 / β K 2 Plot the isoclines for 2 species together to examine population trajectories K 1 / α > K 2K2/β > K1For species 1: K1 > K2α (intrasp. > intersp.) For species 2: K2 > K1β (intrasp. > intersp.) K 1 K 1 / α = stable equilibrium Coexistence at a stable equilibrium Lotka-Volterra Model N 1

Mechanisms of Competition Dissecting exploitation competition reveals its indirect nature H - P Solid arrows = direct effects ; dotted arrows = indirect effects - + + - H Redrawn from Menge (1995) Exploitation competition Interference competition (direct aggression , allelopathy , etc .) P - P H - H

Mechanisms of Competition David Tilman Cain, Bowman & Hacker (2014), Fig. 12.4, after Tilman et al . (1981 ); photos of diatoms from Wikimedia Commons; photo of Tilman from http://www.princeton.edu/morefoodlesscarbon/speakers/david-tilman/ Synedra Asterionella

Mechanisms of Competition David Tilman Cain, Bowman & Hacker (2014), Fig. 12.4, after Tilman et al . (1981 ); photo of Tilman from http://www.princeton.edu/morefoodlesscarbon/speakers/david-tilman/

Asymmetric vs. Symmetric Competition Cain, Bowman & Hacker (2014), Fig. 12.7

Robert MacArthur (1930-1972) Classic Pattern Interpreted as Evidence for Competitively-Structured Assemblages Painting of “MacArthur’s warblers” by D. Kaspari for M. Kaspari (2008); anniversary reflection on MacArthur (1958)

Character Displacement Cain, Bowman & Hacker (2014), Fig. 12.19, after Lack (1947) The “ Ghost of Competition Past ” ( sensu Connell 1980) is hypothesized to be the cause of the beak size difference on Pinta Marchena