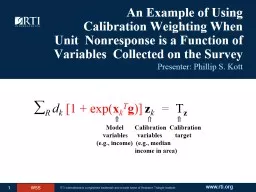
/
GTCAO calibration tools and laboratory GTCAO calibration tools and laboratory

GTCAO calibration tools and laboratory - PowerPoint Presentation

melody
melody . @melody
Follow
66 views
Uploaded On 2023-09-24

GTCAO calibration tools and laboratory - PPT Presentation

results Icíar Montilla M Reyes M Núñez J Marco de la R osa O Tubio M Puga Instituto de Astrofísica de Canarias Ali Basden Durham University GTCAO overview ID: 1020780

lab gtcao system calibration gtcao lab calibration system normalized camera ngs simulator modes results measured maximum bright dasp sdarc

Share:

Link:

Embed:

Download Presentation from below link

Download Presentation The PPT/PDF document "GTCAO calibration tools and laboratory" is the property of its rightful owner. Permission is granted to download and print the materials on this web site for personal, non-commercial use only, and to display it on your personal computer provided you do not modify the materials and that you retain all copyright notices contained in the materials. By downloading content from our website, you accept the terms of this agreement.


Presentation Transcript

1. GTCAO calibration tools and laboratory resultsIcíar Montilla, M. Reyes, M. Núñez, J. Marco de la Rosa, O. Tubio, M. Puga (Instituto de Astrofísica de Canarias)Ali Basden (Durham University)

2. GTCAO overviewOptical bench calibration system and toolsLaboratory resultsOngoing and future workContents

3. GTC Adaptive Optics SystemModeSingle conjugate correction, NGS (first light)Wavelength range1.0-2.5µm (goal 0.8-5.0µm)Strehl ratioBright NGS on axis, SR≧0.65 @ 2.2µmNGS mR=14.5, SR≧0.1 @ 2.2µmWave-Front SensorShack-Hartmann 20x20 (FOV 3.5”), EMCCD (240 x 240pix)Wave-Front CorrectorDeformable Mirror (21x21, 373 actuators, Fried Geometry)Throughputat least 70% in the range 1.0-2.5 µmEmissivityless than 20% at 3.8 µmSeeingUp to 1.5 arcsecScience FOVUp to 1.5 arcminZenith distance0-60ºExposure timeat least one hour

4. GTCAO Opto-mechanical designK-systemOAP1FMDeformable MirrorOAP2DicroicWFSADCTest Camera or FRIDACalibration system

5. GTCAO Opto-mechanical designCalibration systemK-systemDeformable MirrorWFSTest Camera

6. GTCAO calibration system: GTCSim and FieldSimGTC and Turbulence Simulator NGS Simulator (VIS and IR) LGS Simulator Phase Screen (rotating) Aperture SimulatorFocal Plane Unit Telescope or GTCSim selection Field Simulator IR and VIS sources across the 2’ FOVWFS position calibrationField aberrations of the WFC focal planeBuild Interaction Matrix Calibration of Non-common Path (NCP) aberrations

7. GTCAO calibration system: TestCamTest Camera based on an comercial InGaAs Xenics camera320x256 pixels, 30 mm/pixel Plate scale 0.011 arcsec/pixel

8. GTCAO calibrations: WFS calibrationflat mirror (dummy DM)synthetic modal IM created with DASPZernike modes computed from WFS centroidsinput modes recovered with WFS

9. Tests Configuration:Laboratory: air-conditioning on, GTCAO without enclosure (local turbulence)WFC: No rotationTest Camera (science focus): H band filterWFS: - High order lenslet array (20x20) with mask - OCAM2 frame rate 1000 Hz and 2000 Hz - Wide band filter (500 nm to 900 nm)Calibration System: - Visible and IR NGS in “bright star” configuration, on axis - Standard turbulence (r0=20 cm, wind speed= 10 m/s) - GTC PupilRTC: - DARC, Regularized Least Squares algorithm - Controller: simple integratorPreliminary results in the lab

10.

11. simulated PSFGTCAO TestCam PSFPreliminary results in the lab: measured PSFSecond ring not observed, NCPAs, vibrations….Bright star, r0=20 cm, close loop, H band

12. Preliminary results in the lab: measured StrehlS=65%S=65%S=57%SDARC+DASP=74%SDARC+DASP=73%SDARC+DASP=72%compute normalized theoretical diffraction-limited PSF with hexagonal pupil. Find maximumsubtract lab image backgroundnormalize lab measured PSFfind maximum of normalized measured PSF (Gaussian fitting)divide maximum of normalized lab PSF by maximum of normalized theoretical diffraction-limited PSFLaboratory AC, no enclosure, NCPA, simple controller, no specific TT controller, …v= 10 m/sv= 6 m/sv= 3 m/s

13. bright star, r0=20 cm, 1000fpsPower Spectral Density of the Tip, the Tilt and the higher Zernike modes till mode 40 rejection of 2 orders of magnitude of the Tip and Tilt, and 3 orders of magnitude of the higher Zernike modes Preliminary results in the lab: PSD

14. Ongoing and future workFOV calibrationscontrol optimizationNCPApupil rotationperformance for faint NGSLGS upgrade