/
Measuring the Fake Lepton Background in a Search for Measuring the Fake Lepton Background in a Search for

Measuring the Fake Lepton Background in a Search for - PowerPoint Presentation

mentegor
mentegor . @mentegor
Follow
342 views
Uploaded On 2020-07-01

Measuring the Fake Lepton Background in a Search for - PPT Presentation

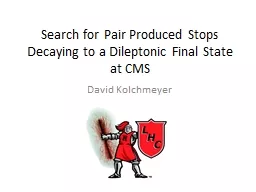
Supersymmetry David Kolchmeyer Advisor Alberto Graziano Overview Brief description of analysis and method Background prediction in SS mumu channel Background prediction in OS mumu ID: 791924

loose fake data tight fake loose tight data qcd leptons plots lepton background sample electrons muons prediction distributions jet

Share:

Link:

Embed:

Download Presentation from below link

Download The PPT/PDF document "Measuring the Fake Lepton Background in ..." is the property of its rightful owner. Permission is granted to download and print the materials on this web site for personal, non-commercial use only, and to display it on your personal computer provided you do not modify the materials and that you retain all copyright notices contained in the materials. By downloading content from our website, you accept the terms of this agreement.


Presentation Transcript

Slide1

Measuring the Fake Lepton Background in a Search for Supersymmetry

David KolchmeyerAdvisor: Alberto Graziano

Slide2

OverviewBrief description of analysis and method

Background prediction in SS mumu channelBackground prediction in OS mumu

channelThings to do for the future

Slide3

Analysis and Method

Searching for same sign dileptons from pair produced stopsControl region MT2 < 80Estimate background from one real and one fake lepton from data

Define ‘loose’ electron, measure ratio of fake tight to fake loose leptons in QCD sampleLook for loose-loose events in dilepton data, weight events to get predicted fake tight-tight background

Slide4

Event Weighting

Tight-Loose

Tight-TightLoose-LooseLoose-TightTTLL

TLLT

ε

=


η

=


Tight/loose for fake leptons

loose/tight for real leptons

Error propagation implemented in code

p

≈ 1 (good

approx

for

muons

, not electrons)

Slide5

QCD sample

Combining T_HLT_Mu8_v16 and T_HLT_Mu17_v3 triggersWeight muons by 1/(luminosity of trigger path) to combine the triggers

Overlap of 51/154368 eventsVeto events with Z candidate or low mass resonanceRequire MET < 20 GeV and MT < 15 to reduce EWK contributionsRequire an away jet of DeltaR > 1 between the jet and all loose electrons/muons in eventFake rate error given from binomial formulaerr(FR) = sqrt(FR(1-FR)/Loose)

Slide6

QCD sample plots

Away jet distributionFake rates in different binsMET vs MT2ll in data and Zjets,

Wjets

Slide7

SS Plots- Bkg Yield

Slide8

SS Plots- Distributions

Missing some MC processes….

SS region should be dominated by fake processesLow statistics

Slide9

Compare Muon Isolation in QCD and SS Data

Slide10

OS Plots- Bkg Yield

Slide11

OS Plots- Distributions

Prediction somewhat agrees with MC for the fake backgrounds…

Slide12

Compare Isolation in QCD and OS Data sample

The distributions don’t agree because we are comparing prompt and fake leptons to fake leptons only. Hence data will have more prompt leptons with tighter Iso

Slide13

Bias in QCD sampleWe only ask for single lepton triggers, but there was a

dilepton requirement when trees were madeSecond lepton probably is looser, has greater isolation

Slide14

For the FutureDo EWK removal

Obtain an unbiased single lepton sampleFind a control region with more statistics (verify with RelIso distribution)Do this for electrons!Do this with 20

ifb

Slide15

Thank you!