/
1 Using ethical dilemmas to predict antisocial choices with real pay 1 Using ethical dilemmas to predict antisocial choices with real pay

1 Using ethical dilemmas to predict antisocial choices with real pay - PDF document

mia
mia . @mia
Follow
344 views
Uploaded On 2021-07-05

1 Using ethical dilemmas to predict antisocial choices with real pay - PPT Presentation

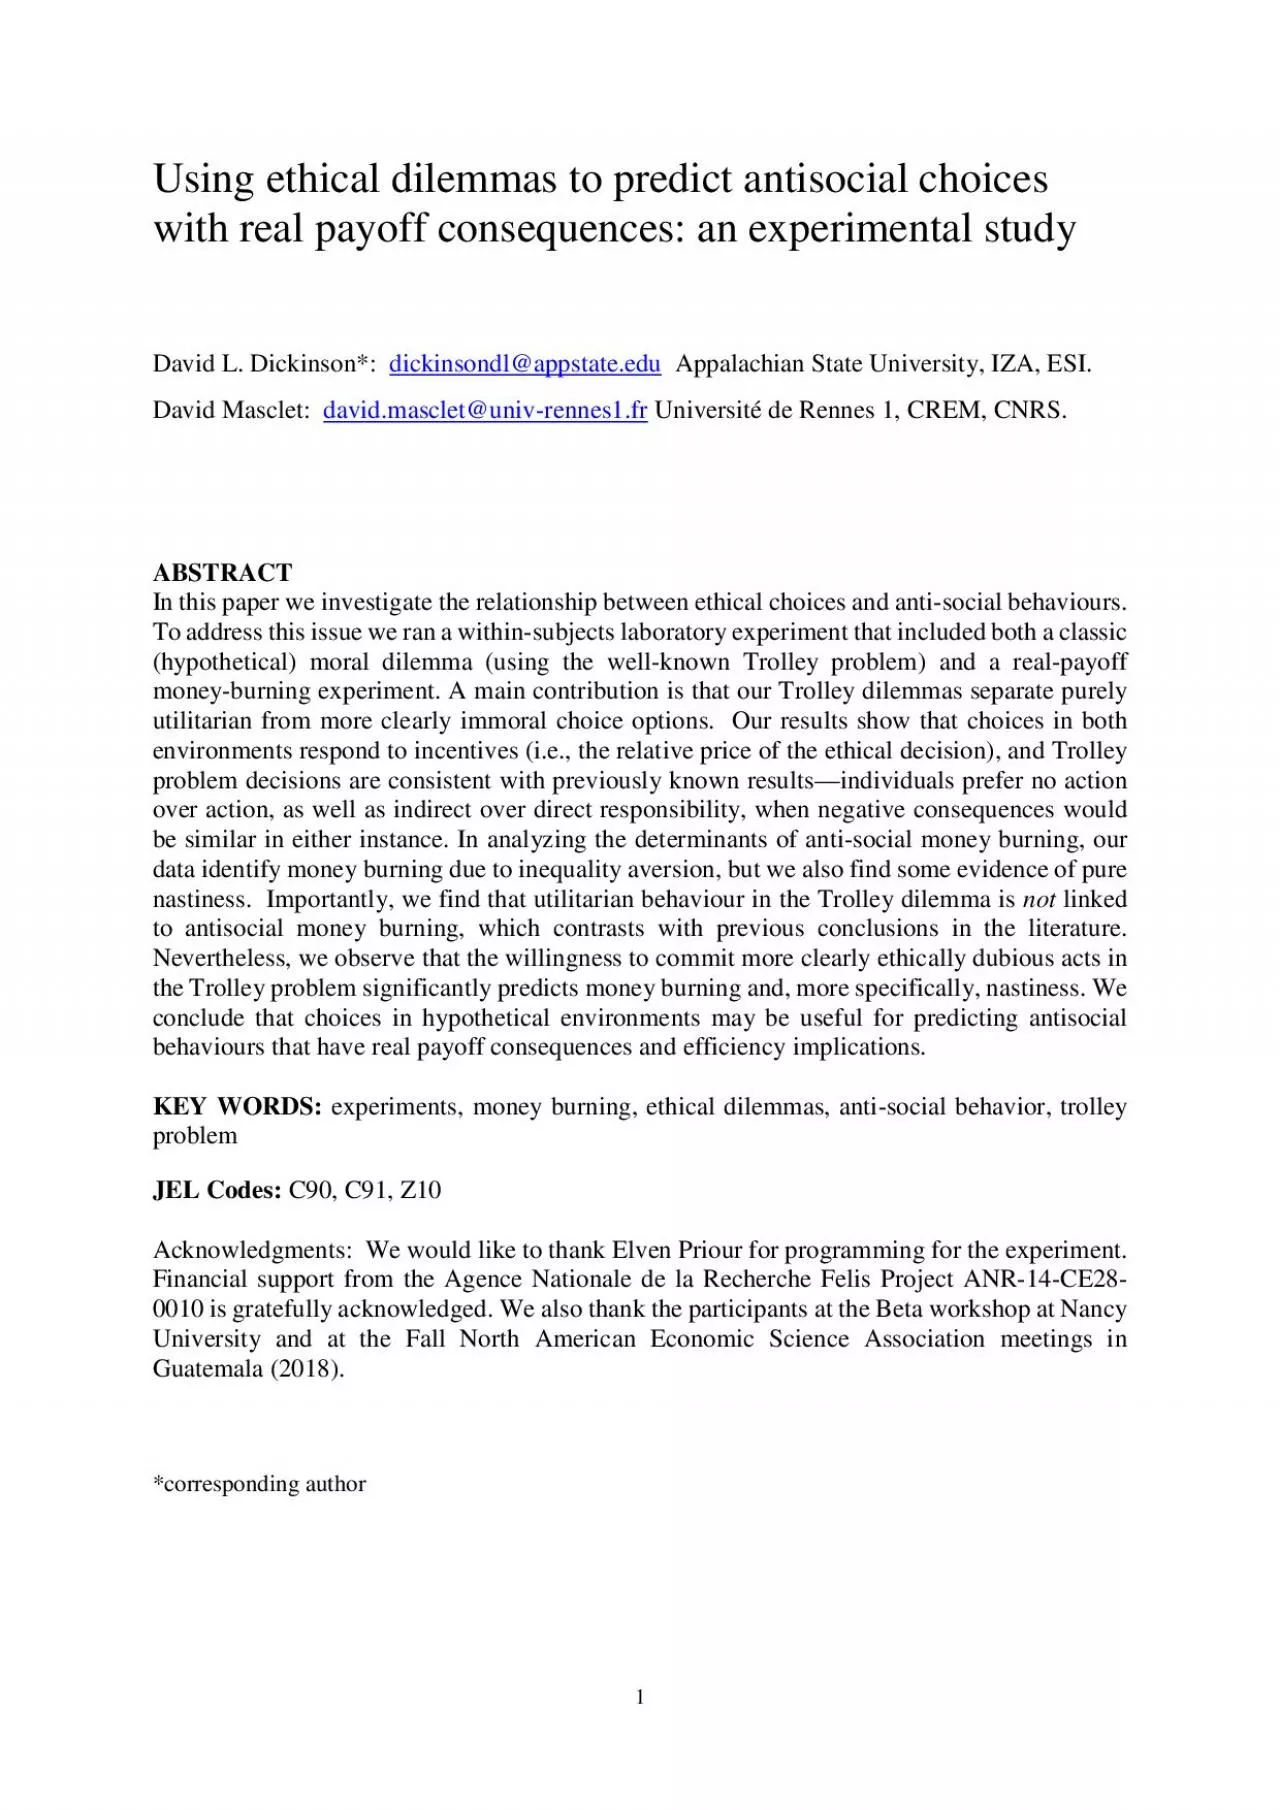
dickinsondlappstateedu Appalachian State University IZA ESI David Masclet Universit ID: 854270

trolley money burning moral money trolley moral burning action dilemma burn dilemmas choices cost payoff lives table choice antisocial

Share:

Link:

Embed:

Download Presentation from below link

Download Pdf The PPT/PDF document "1 Using ethical dilemmas to predict anti..." is the property of its rightful owner. Permission is granted to download and print the materials on this web site for personal, non-commercial use only, and to display it on your personal computer provided you do not modify the materials and that you retain all copyright notices contained in the materials. By downloading content from our website, you accept the terms of this agreement.


Presentation Transcript

1 1 Using ethical dilemmas to predict an
1 Using ethical dilemmas to predict antisocial choices with real payoff consequences: an experimental study David L. Dickinson*: dickinsondl@appstate.edu Appalachian State University, IZA, ESI. David Masclet: Université de Rennes 1, CREM, CNRS. ABSTRACT In this paper we investigate the relationship between ethical choices and anti-social behaviours. To address this issue we ran a within-subjects laboratory experiment that included both a classic 2 1. Introduction Unethical behavior within organizations is not rare and often results in high costs for the entire society. Antisocial behaviours can result in relational, workplace, or other costs to society that are nontrivial. Cyber-sabotage is now a growing concern, for example (see Line et al, 2014), and survey data from the U.S. and Europe document antisocial workplace behaviours that include mistreatment, verbal abuse, and sabotage, with estimates indicating these may impact 10%-35% of people in the workplace (see Charness et al, 2013). Field data examples often pose difficulties in our attempt to understand the core determinants of antisocial tendencies given that they may be confounded with self-interest, hidden from view, or contaminated by reputational concerns. While the estimated prevalence of clinical-level antisocial personalities disorders in the general population ranges from 1%-4% (Werner et al, 2015), subclinical levels of anti-social personality disorders more common and on the rise in young adults (Twenge and Foster, 2010). Behavioural metrics that help identify the likelihood that someone engages in antisocial behaviours can therefore be a useful way to prevent antisocial behavioural costs and improve overall welfare. At first glance antisocial behaviors appear morally inappropriate. However, some choices that may be considered antisocial may be deemed morally acceptable using an alternative moral metric. For example, when U.S. President Harry Truman decided to drop atomic bombs on Hiroshima and Nagasaki in 1945 to end WWII, he was faced with a great ethical dilemma. Although the bombs would result in many civilian deaths, Truman estimated that it would ultimately cost fewer lives compared to the alternative. This reasoning is based on utilitarian moral principles, according to which the goodness or evil of an action is determined solely by its conseque

2 nces (Mill, 1861; Bentham, 1789). In oth
nces (Mill, 1861; Bentham, 1789). In other words, if somehow you can save 10 lives by sacrificing one person, then it is justified to sacrifice that person. This view of morality, however, is at odds with the Kantian deontological view,  Data from the U.S. includes research from the Workplace Bullying Institute http://www.workplacebullying.org/) and the Bureau of Labor Statistics (www.bls.gov, considering that at least some of the workplace stoppage data represents an exercise of incurring some cost in order to impose even larger costs on a counterpart), and data from the French Ministry of Employment are from the SUMER medical monitoring survey of workplace risks (surveying over 50,000 workers in the 2010 wave, see https://www.eurofound.europa.eu/observatories/eurwork/articles/working-conditions/france-working-conditions-and-occupational-risks-sumer-2010). For instance, while there exists strong evidence that workers do not hesitate to engage in unethical activities in contests, it remains difficult to clearly disentangle whether sabotage activities are driven by pure anti-social tendencies or by monetary benefits associated with an increase in chance of winning the context by reducing the output of the opponent (e.g. Lazear, 1989). The atomic bombs dropped, resulted in the deaths of about 250,000 Japanese (New York Times, 1995). The alternative was to launch an invasion. Truman claimed in his memoirs that this would have cost another half a million American lives. 3 according to which some actions can never be justified by their consequences; they are absolutely forbidden (Kant, 1787). In other words, it is always wrong to sacrifice an innocent person even if additional lives are saved as a result. In this current study we address a question raised in the literature: is there a connection between utilitarian and anti-social or immoral choice? Additionally, do moral choices obey the law of demand? To address these issues we ran a within-subjects laboratory experiment to study choices in a classic moral dilemma, the well-known (hypothetical) Trolley problem, as well as choices in a consequential (i.e., real payoffs) money-burning experiment. The Trolley dilemma has captivated moral philosophers for decades (Foot, 1967; Thomson, 1985; Spranca et al, 1991; Petrinovich et al, 19

3 93). The dilemma describes a runaway tr
93). The dilemma describes a runaway trolley that, unless an action is taken, will run over several individuals on a track who are unable to escape. Action typically results in the death of a different individual but research shows upwards of 90% of individuals are willing to endorse the sacrifice of one to save (typically) five others (see Navarette et al, 2012 and references therein). Various versions of the problem exist (see Shallow et al, 2011), but we focus on perhaps two of the most classic scenarios. The first assumes a runaway trolley is bound to kill several individuals on a main set of tracks unless one pulls a lever to divert the trolley onto a side track where it will kill anyone who may be on the side track. Such a decision scenario is considered an “indirect” (or impersonal) moral choice in the sense that pulling the lever to save lives indirectly but intentionally results in the death of those on the side track. A second version is considered a “direct” (or personal) moral choice scenario where instead of pulling a lever one must push an individual onto the main track (and that person will die) in order to save those on the main track (Thomson, 1985). The Trolley dilemma has come under fire for its lack of realism, low external validity, sensitivity to varied contextual details, inability to truly instruct us about utilitarianism, and failure to evoke psychological processes similar to other moral dilemmas (Rai and Holyoak, 2010; Bauman et al 2014; Kahane, 2015). Nevertheless, others have found it useful for studying various components of moral reasoning (e.g., Cushman et al, 2006; Greene et al, 2001; Greene et al, 2011), such as the identification of behavioural norms or highlighting that certain moral dilemmas preferentially engage emotional centers in a way that may be important in predicting choice (e.g., Greene et al, 2001; Navarette et al, 2012). Still others have noted how the Trolley dilemma can highlight the difference between acts of omission versus commission (Spranca et al, 1991; Cox et al, 2017), which is a relevant distinction in courts of law. And, while past criticism of the Trolley dilemma may have seemed justified due to the unrealistic nature of the 4 decision it presents, the relevance of the Trolley dilemma is at a higher level than perhaps ever before with the recent rise in ethical conce

4 rns surrounding self-driving vehicles.
rns surrounding self-driving vehicles. Bonnefon et al, (2016) highlight how the moral dilemma relates to the social dilemma of Autonomous Vehicle (AV) adoption, whereby most survey respondents agreed an AV should be programmed to sacrifice its passenger(s) if more pedestrians are saved as a result, but these same individuals thought it much less appropriate to program the AV as such if one’s own life were at stake. Another recent study (Awad et al, 2018) documented how global views on Trolley dilemmas vary by culture, but summary statistics from large sample studies are focused on mean tendencies as opposed to examining “outlier” response patterns that may be informative regarding antisocial tendencies. In economics, studies focusing on the antisocial dimension of behaviour include the seminal studies by Zizzo and Oswald (2001) and Zizzo (2004), whose results show that many subjects are willing to incur a real cost in order to reduce other’s payoffs—“money burning”. Money burning may be explained by inequality aversion (Zizzo and Oswald, 2001), but it may also result from a pure pleasure of being nasty (Abbink and Sadrieh, 2009; Abbink and Herrmann, 2011). Of course, Becker’s (1968) seminal work on the economics of crime was highly influential and focused attention on the cost-benefit calculus of many decisions in the moral domain. Other relevant work relates to Fehr and Gächter’s (2000) seminar paper examining peer punishment in group contribution environments, which could represent an environment where antisocial punishment is exhibited. But, these same authors noted the potential for peer-punishment to be prosocial as opposed to antisocial given certain conditions are met (Fehr and Gächter, 2002). Our goal is to contribute to the literature in the following ways. First, we exploit a within-subjects strategy method design to examine the ability of moral identifiers, as derived from Trolley dilemma decisions, to predict consequential choices in the money burning game. The money burning game is of interest as it elicits revealed anti-social preferences that represent an alternative to self-report personality measures. The predictive validity of ethical dilemma responses has been of interest in the recent literature, though not without debate. A recent study argues that hypothetical ethical dilemmas are not useful for predicti

5 ng behaviour in real dilemmas (Bostyn et
ng behaviour in real dilemmas (Bostyn et al, 2018), though their study differs from ours on critical dimensions. Individual characteristics may be yet another factor that explains money burning decisions. For instance, some previous studies have shown that high basal testosterone is associated with an increased threshold for conflict (see Carney and Mason, 2010, and references therein). Bostyn et al (2018) examine whether Trolley dilemma responses predict one’s propensity to deliver electric shocks to mice in dilemmas with similar but nonfatal scenarios. In addition to the fact that their hypothetical 5 Other studies have already suggested a connection between antisocial personality types and a willingness to make utilitarian choices that may be considered morally difficult (Koenigs et al, 2007; Bartels and Pizarro, 2011; Gao and Tang, 2013; Bracht and Zylbersztejn, 2018), though not all studies have supported this conclusion (see Cima et al, 2010, for example). Those studies that do suggest the antisocial-utilitarian link, however, suffer from a key confound. Specifically, in their studies it is always utilitarian to sacrifice the life because more would be saved. Thus, existing studies cannot separate utilitarian behaviour from less savoury preferences. Our study, in contrast, includes Trolley dilemmas that help solve this identification problem and allow us to construct relatively unambiguous moral identifiers. These moral identifiers are shown to have power predicting antisocial behaviour in the consequential money burning game where resources destruction reveals a type of anti-social preference. If choices in hypothetical moral thought experiments can help identify those likely to make antisocial choices, it may be possible to improve overall welfare (e.g., improved job matching, delegation of authority, mate selection). Secondly, our paper will also contribute to the literature by investigating the extent to which costly money burning decisions and Trolley choices obey the law of demand. Responses to ethical dilemmas surrounding the adoption of autonomous vehicle technologies, which bear resemblance to the Trolley dilemma, were recently shown to be sensitive to the relative number of lives saved in the scenario (Bonnefon, 2016). Within the context of demand for

6 costly punishment, Nikiforakis and Norm
costly punishment, Nikiforakis and Normann (2008) showed that voluntary contributions to provide  judgment scenarios involved humans and not mice (which were the focus of their « real-life » ethical dilemmas), their study also involved deception. Specifically, the mice were not actually sacrificed as per the participants’ decisions and so a de-briefing was also used in their study. Using self-report measures of antisocial personality tendencies (Bartels and Pizarro, 2011; Gao and Tang, 2013) or patients with brain damage in regions important to emotion generation (Koenigs et al, 2007), these studies find tendencies towards increased utilitarianism in individuals with antisocial personality traits. Another recent study (Bracht and Zylbersztejn, (2018) is quite related to ours in that it also examines ethical choice in hypothetical dilemmas as well as in a consequential money transfer game. The differences in our study are notable, however. First, we do not pool data across indirect versus direct moral choices as they do, which is important given we identify a highly significant (p .01) impact of this factor on one’s willingness to take action (we also show that one of their key results is qualified in our findings by conditioning on the direct versus indirect nature of the dilemma). Secondly, both our hypothetical and consequential choice experiments vary the relative efficiency or cost of one’s action, thus allowing a more thorough examination of ethical and antisocial choice. Finally, we use a morality measure derived from the Trolley dilemma to predict behaviour in the consequential money burning game, while Bracht and Zylbersztejn (2018) examine the reverse causation. While of potential interest, we find the causation of hypothetical-to-consequential choice more valuable in terms of implications and use as a potential screening or identification mechanism (e.g., job application/interview screener). Additionally, it is still the case that the dilemmas used in their study suffer from the key confound whereby utilitarian preferences cannot be separated from certain types of immoral preferences. It is therefore important to note that many moral dilemmas confound the utilitarian choice from the choice one might make for non-utilitarian reasons. For example in the typical T

7 rolley dilemma, it is utilitarian to pul
rolley dilemma, it is utilitarian to pull the switch or push the individual, and yet one may be willing to act not because more lives are saved than lost, but rather because one prefers or perversely enjoys being responsible for someone’s death. 6 a public good increase monotonically in punishment effectiveness, and Anderson and Putterman (2007) found that the price of punishment is a significant determinant of punishment demand. These previous studies suggest that even the moral domain of choice should obey the law of demand. To our knowledge, no previous study has attempted to investigate the role played by relative cost in the context of money burning decisions. Our set of Trolley dilemmas allows us to explore efficiency (utilitarian outcomes), which implies that the dominant concern should be minimizing the number of lives lost, even when we vary the price of inefficiency. Finally, we attempt to investigate the determinants of antisocial behaviours using measures derived from both the real-payoff money burning experiment and the hypothetical Trolley dilemma. Not all money burning should be considered immoral or antisocial (e.g., inequality aversion would not be considered antisocial). In conjunction with our exploration of the determinants of money burning—both nasty and more justifiable resource destruction—we hope to further our understanding of some key determinants of (un)ethical choices. Indeed, specific Trolley dilemmas can identify more ethically dubious choices, thus allowing us to classify one’s morality. We are also able to distinguish an immoral act of commission from an immoral act of omission, which yields a more rich set of morality variables to consider as predictors of money burning decisions. To preview our main findings, we find thatoutcomes in the Trolley dilemma are both consistent with previously known results but also make new contributions to the literature in an important way. Namely, we score morality variables from an identifiable subset within our menu of Trolley dilemmas and show that morality from the hypothetical Trolley dilemma can predict consequential and inefficient antisocial behaviours. We find that utilitarian behaviour in the Trolley dilemma is not linked to antisocial money burning, which contrasts with previous conclusions in the literature that antisocial types are more utilitarian

8 (Koenigs et al, 2007; Bartels and Pizarr
(Koenigs et al, 2007; Bartels and Pizarro, 2011; Gao and Tang, 2013; Bracht and Zylbersztejn, 2018). Nevertheless, we observe that the willingness to commit ethically dubious acts in the Trolley problem significantly predicts money burning and, more specifically, nastiness. Our data also indicate that the relative cost of the ethical decision matters, as should be expected. Regarding the determinants of money burning, we find evidence that inequality version is present, but nastiness is observed because some individuals burn a counterpart’s money even when already at a payoff advantage. 2. Experimental design 2.1. Overview 7 Both the Trolley and the money burning experiments were administered in strategy method format, where decisions were elicited on multiple decisions prior to a randomized draw of one (in the incentivized money burning task) for real payoff. Table 1 describes the menu of dilemmas administered in our version of the Trolley dilemma. Importantly, we highlight that our choice menu allows us to examine how the likelihood of taking action responds to the number of people saved (X) relative to killed (Y). We are also able to examine preferences for inaction over action when the number of lives lost would be unaffected (i.e., X=Y dilemmas). And finally, we can examine how one’s likelihood to take action differs if action is indirect (i.e., pull a lever to divert the runaway trolley) versus more direct (i.e., push an individual(s) onto the track to stop the runaway trolley), which we call INDIRECT versus DIRECT decision scenarios. In what follows, we scored immorality as derived from the Trolley dilemma choices as follows: Immoral Omission is an indicator variable equal to one if a subject chose to not take action in the DIRECT and INDIRECT (X,Y)=(6,0) scenarios, where action would save 6 individuals without any lives being lost as a result. Another dichotomous variable, Immoral Commission, equals one if the subject chose action in both the (X,Y)=(6,6) and (1,1) scenarios of both the INDIRECT and DIRECT choice dilemmas. In the case of Immoral Commission, the subject prefers to be responsible (via action) for a given number of deaths rather than passively allow that same number of deaths to occur. We created a final variable by taking a subject’s average propensity to act in the remaining scenarios not used in th

9 e construction of the Immoral Omission o
e construction of the Immoral Omission or Immoral Commission variables. Such a variable, Action Propensity, represents one’s willingness to take action, though it also describes utilitarian preferences in our dilemmas. For the money burning game, a key treatment variable is whether only one in the pair (the “decider”) or both individuals could burn money. Specifically, in the Bilateral Burn treatment, both players could mutually and simultaneously destroy a portion of each other’s payoffs. That is, each of the two subjects in a randomly matched pair made money burning decisions and two random decisions were selected such that each subject was both a decider and passive recipient (i.e., potential money burn victim) in a consequential money burning choice. In Unilateral Burn, subjects were randomly assigned as decider or passive recipient  We also varied the ordering of the Money Burning (x,y) pairs in the menu received (presenting the decision maker’s endowment in Increasing, Decreasing, or Random order. Each subject saw only one ordering). We did not have a formal hypothesis regarding the ordering of the money burning scenarios, and later analysis documents that the varied ordering does not significantly impact outcomes in the task. We considered variation in the order more exploratory. Of course, there is no theoretical reason to believe that the ordering should matter, but this possibility has been investigated on the more well-known Holt and Laury (2002) risky choice lottery menu (see Bruner, 2009). 8 before decision making, and only the deciders made decisions. After decisions were made in all 9 money burning scenarios, deciders and recipients were randomly matched and one scenario was selected at random to determine the payoff of both players in the money burning game. This process was common knowledge.2.2. Experimental procedures The experiment was computerized and administered using the Z-tree platform (Fischbacher, 1999). We recruited 150 subjects at the University of Rennes 1 (France), each subject participated in only session, and none had participated in a similar economic experiment. A total of 9 sessions were conducted (with 14 to 18 subjects per session), where in each session subjects were administered the Money Burning game followed by the Trolley dile

10 mma.10 Table 3 contains summary informa
mma.10 Table 3 contains summary information about number of participants in each treatment of the Money Burning game, which is identified by the order of presentation of the scenarios (see footnote 4) and whether the Unilateral or Bilateral Burn treatment. Importantly, subjects were given the choice to opt out of the Trolley Dilemma for whatever reason. A total of 12 subjects (8%) chose to opt out of the Trolley dilemma task, and we use this “opt-out” in the analysis of money burning choices below. A session lasted approximately one hour (this includes the time spent to read the instructions). At the end of the experiment, one task was randomly selected for each pair of randomly matched subjects (and random role assignments, in the case of Unilateral Burntreatments). Payments were made anonymously at the end of the session and the average earnings were 25.52 Euros per subject. 3. Behavioural Predictions and Theoretical Foundations Though we describe a set of predictions based on behavioural considerations, it is important to highlight that one can identify theoretical underpinnings of these behavioural predictions.  Our design made use of the strategy method, as opposed to direct elicitation method, in order to generate multiple observations from each subject in each decision experiment (other than the passive recipients in the money burning game, which were randomly selected prior to decision making in that game). Brandts and Charness (2011) survey experimental results comparing strategy method versus direct elicitation and conclude that the strategy method for response elicitation, in general, provides a conservative estimate of what choice would be using direct response elicitation—in our case, money burning choices may therefore be a conservative estimate of outcomes one would find using direct elicitation of just a single response in a single scenario. 10 This ordering is important in order to limit the potential for morality priming prior to the Money Burning game (i.e., we considered it much less a concern that playing the Money burning game would prime participants prior to the Trolley Dilemma given its neutral context compared to the sensation and obviously morality context of the Trolley Dilemma) 9 Consider, for example a model based on Figuieres et al (2013)

11 , that considers intrinsic moral obligat
, that considers intrinsic moral obligations within the utility function (see also, Nyborg 2000, Brekke et al, 2003, Dickinson et al. 2018). The idea is that a utility function may include a moral obligation grounded in a Kantian categorical imperative (Lafffont, 1975; Harsanhi, 1980).11Assume, for example, that one’s action, a, generates both benefits, , and costs, . Further assume a function  where  describes one’s moral imperative or obligation, and a deviation from this moral standard of action, , generates disutility. Then, one’s utility function can be described by:  \n (1) Here, we assume b’ � 0, c’ � 0, b’’ 0, ’’ .66;酠 0, such that utility benefits and costs are increasing in the action, and benefits increase at a decreasing rate while costs increase at an increasing rate. The disutility of deviations from one’s moral ideal are captured by assuming v’ .66;酠 0 if  , v’ 0 if  \r That is, moral disutility decreases by moving towards one’s moral obligation from either direction. We also assume that v’’ &#x-6.3;㙵 0 such that marginal disutility increases at an increasing rate as one’s action gets further from the moral obligation. Note that an “action” here is quite general (i.e., higher morality could imply a higher or lower level of the action). All that matters is that actions generate utility costs and benefits, and there is disutility in moving away from one’s moral obligation, whatever that may be. We show in Appendix B that the first order condition from the utility maximization problem can be used to derive the following (intuitive) comparative static result:  In other words, one’s optimal action moves in accordance with one’s moral obligation. This implies that differences in moral choice across individuals in hypothetical environments are either the result of cost and/or benefit differences due to the action, or they are the result of differences in moral obligations across individuals.12  11The inclusion of moral values into motivations is part of the early history of economic thinking and dates back at least as far as Smith (1759). 12Alternatively, differences in moral choices may also result from mistakes in maximization (i.e., error, or perhaps lack of motivation due to hy

12 pothetical nature of choice). However, i
pothetical nature of choice). However, if immorality as identified in our hypothetical Trolley environment can predict other unethical or antisocial choice, it implies the hypothetical choices are not mistakes but rather reflect fundamental differences in individuals’ morality views that may help predict choices in other moral domains that are consequential. 10 3.1. Trolley Problem First consider the theoretical predictions in the trolley problem. In absence of moral considerations, purely selfish decision makers (the homo economicus) should be indifferent between action and inaction since their material payoff remains unaffected in both cases. In sharp contrast, a utilitarian should always take an action when the number of lives saved is higher than the number of lives sacrificed since it maximizes the aggregate welfare (Bentham, 1789/1961; Mill, 1861). Consequently assuming that agents are utilitarian, we posit that a decreased relative cost of action should increase action likelihood. In other words, we predict a downward sloping demand curve for lives saved in this moral dilemma. Let us now consider that agents have morality concerns. The introduction of morality concerns into the utility function may prevent agents from acting despite the existence of a net gain in terms of lives saved. If the moral cost of taking an action in the Trolley problem is sufficiently high, individuals should never act, irrespective of the material aggregate net benefit from doing so. This is summarized in hypothesis H1: H1 (Trolley): a) According to utilitarian principles, the likelihood of action will increase in the relative number of lives saved. b) Individuals with sufficiently high moral concerns will never take action in the Trolley problem. Proof of H1: see appendix B. Our second assumption concerns the specific dilemma in the Trolley problem where lives lost are unaffected (X=Y dilemmas) or when action is costless (any (X,0) dilemma). In our set of Trolley dilemma choices we can then focus on (X,Y) pairs (6,6) and (1,1), where an equal number of individuals would perish whether or not action is taken. In these cases, we hypothesize a lesser likelihood to act given a preference to not be responsible (via action) for the deaths. To take action in such cases could be considered an immoral act of commission. Also of interest would be the (0,6)

13 Trolley dilemma, where action costs no
Trolley dilemma, where action costs no lives. In such a dilemma, to not take action would be consider an immoral act of omission. Both individuals and courts of law consider an act of omission to be a lesser “sin” than an act of commission that results in similar consequences (see Cox et al, 2017). This principle with respect to the Trolley dilemma has been labelled the “action principle”. This is stated in hypothesis H 2: 11 H2 (Trolley): When lives lost are unaffected (X=Y dilemmas), inaction is preferred over action (moral omission). Also, action is preferred over inaction when action is costless (any (X,0) dilemma) (moral commission). Rejection of H2 implies acts of ImmoralOmission or Commission. Proof of H2: see appendix B Our last assumption regarding the Trolley problem concerns the role of framing. The literature identifies two clear predictions we can make regarding outcomes in the Trolley dilemma. First, a widely reported result is that individuals are more willing to take action and save lives in the INDIRECT frame where a level is pulled, as compared to the DIRECT frame where an individual is pushed onto the track, holding constant the relative number of lives saved. This is related to the distinction between personal and impersonal moral dilemmas (Greene et al, 2001). Thus, our third hypothesis stems from this “contact principle” (Cushman et al, 2006). This hypothesis implies that for each pair (X,Y) of lives (saved, lost), we predict an individual is more likely to take action in the INDIRECT frame. H3 (Trolley): For each (X,Y) dilemma, action is more likely in the INDIRECT Frame Proof of H3: see appendix B 3.2. Money Burning Consider now the theoretical predictions of the money burning game. Purely selfish individuals should never burn money since there are no material benefit associated with money burning decisions. The same predictions apply for utilitarian agents who would never choose to reduce total welfare. Thus, under the assumption of either pure selfishness or utilitarianism, there should be no money burning. The same predictions should apply for the homo moralis, i.e. agents with sufficiently high moral concerns. Only individuals with nasty preferences may be incited to burn money. This is stated in assumption H4 H4 (Money Burning): under the assumption of either pure selfishness or utilitarianism

14 , there should be no money burning. Only
, there should be no money burning. Only individuals with nasty preferences will burn money. Proof of H4: see appendix B 12 In addition to pure nastiness, individuals’ decisions in the money burning game may be also motivated by inequality aversion concern (Zizzo and Oswald, 2001; Abbink and Sadrieh, 2008; Abbink and Herman, 2011). According to inequality models utility depends not only on one’s own payoff but also on the equality of the income distribution (see Fehr and Schmidt, 1999).13 In our framework, if disadvantageous inequality aversion matters, one should therefore observe money burning when xy, while money should not be burnt in cases of advantageous inequality (i.e., x y). H5 (Money Burning): Strongly inequality averse people should burn money in case of disadvantageous inequality only (i.e., xy). Proof of H5: see appendix B. Let’s now focus our attention on the behavioural changes induced by the differences between the Unilateral burn and Bilateral burn treatments. Because decisions in the Bilateral Burn treatment are impacted by any (unmeasured) expectations of others’ money burning choices, the pure effect unconfounded by expectations is measured from the comparison with the Unilateral Burn treatment. If individuals burn others’ money and it is common knowledge that money burning is Bilateral, then another motivation for money burning is anticipatory negative reciprocity. This type of “pre-emptive retaliation” relies on the fact that in the simultaneous choice Bilateral treatments one may burn the counterpart’s money on the expectation that the counterpart may burn some of one’s payoff (see Abbink and Sadrieh, 2009). Because of pre-emptive money burning, we should therefore expect more money burning in the Bilateral treatment than in the Unilateral Burn treatment, ceteris paribus. Thus, we have the following money burning hypothesis H6: H6 (Money Burning): Money burning will be higher in BilateralBurn treatment compared to the Unilateral Burn treatment. Proof of H6: see appendix B Just as in the case of the Trolley dilemma, we expect that antisocial tendencies to burn resources of others will nevertheless respond to the price of doing so. Previous studies have  13Indeed, a very appealing hypothesis about distributional preference is inequality aversion (see

15 Loewenstein et al. 1989; Fehr and Schmi
Loewenstein et al. 1989; Fehr and Schmidt, 1999; Bolton and Ockenfels, 2000; Charness and Rabin, 2002). These approaches assume utility depends not only on one’s own payoff but also on the equality of the income distribution. 13 shown that punishment decisions in a VCM context obey the law of demand. (Nikiforakis and Normann, 2008; Anderson and Putterman, 2006). Based on these papers’ findings one may reasonably conjecture that money burning decisions also obey the law of demand and, though the cost of burning is fixed in our design, the amount burnt varies. This implies that the cost of burning money (namely, the cost relative to one’s payoff) in the chosen payoff distribution varies and we can expect an increase in money burning when the relative cost of burning money is low. This leads to H7. H7 (Money Burning): Burning money will be negatively related to its relative cost. Finally, an important contribution we offer in the paper is to consider moral descriptors of one’s choices in the Trolley dilemma as an explanatory variable regarding one’s choice to burn money. Immoral acts of commission and omission are defined in H2 based on the subset of Trolley dilemmas that did not present confounded explanations of one’s choice. Someone who takes action in the (X,Y) Trolley dilemmas not implicated in H2 can be said to have a higher Action Propensity (or is more utilitarian). The morality of those with higher Action Propensity is difficult to assess given that one may be willing to sacrifice one or more lives to save others for more than one reason. Such reasons may include both ethically dubious reasons (i.e., I prefer to push someone to save others) as well as utilitarian reasons (e.g., I will do whatever leads to the most lives saved (least lives lost)). However, our morality variable constructs are intended to separate utilitarian actors from the immoral actors. For this reason, clean moral descriptors of immorality for our final hypothesis focus on metrics derived from a subset of the Trolley dilemmas, and comparison with results in the existing literature linking utilitarianism to antisocial choice can be made by focusing on the Action Propensity impacts. H8 (Money Burning): Moral descriptors derived from the Trolley dilemmas—(X=Y) and (X,0) dilemmas—will predict increased money burning.4. Results 4.1 Trolley Results We fir

16 st share results from the Trolley Dilemm
st share results from the Trolley Dilemma that we used to construct predictor variables used in the analysis of the Money Burning game data. We start by showing summary data from the subjects who made Trolley dilemma choices in Figures 1 and 2 (9 Trolley dilemma choices per subject). Of the 150 participants in our experiment, n=12 subjects opted out of the Trolley 14 dilemma, leaving us with n=138 Trolley subject decision makers (we code these “Trolley opt-out” subjects for later use as a regressor in the money burning estimations in the next section).14 Figure 1 shows the proportion of choices in each treatment (Direct and Indirect dilemmas) for the subset of dilemmas that hold constant the number of lives saved. Left to right on the horizontal axis shows dilemmas that increase the number of individuals sacrificed for a constant X=6 individuals saved. Two things stand out in Figure 1: the proportion of individuals who take action decreases as the relative cost, Y/X, increases; more surprisingly, greater than 20% of subjects did not choose to take action in the (6,0) dilemma where 6 individuals could be saved at zero cost, and some chose (indirect) action in the (6,6) dilemma where the same number of individuals would perish even if nothing were done. Both represent instances of what we call “Trolley immorality”. Figure 2 organizes the remaining subset of Trolley choices to hold constant the number of individuals who perish at Y=1 and the number of lives saved decreases going from left to right in the figure. We again see that action in the Trolley dilemma is responsive to the relative cost (or effectiveness) of the action--subjects are less likely to take action when the relative cost, Y/X, increases (or, as the relative benefit X/Y decreases). In Figure 2, we also see that a nonzero number of subjects choose an immoral act of commission in Trolley dilemma (1,1) where action was chosen even though an individual would perish even with inaction. As noted in Section 3 (Experimental Design), we elicit choices in the strategy method to maximize data generated per subject. Due to multiple decisions per subject, all models in Table 4 include standard errors clustering at the individual subject level. The model structure is a Probit estimation where the dependent variable is equal to one if that subject chooses to take “action” (i.e

17 ., pull the lever or push the individual
., pull the lever or push the individual(s) in that particular dilemma scenario). The different columns of Table 4 show estimations using different sets of independent variables. The first two columns use a dummy variable for each (X,Y) pair of lives saved (X) and sacrificed or killed (Y) compared to the omitted baseline scenario of (X,Y)=(6,0). Columns 3-5 replace the dummy variables with continuous variables measuring the number of lives sacrificed and saved. The dummy variable identifying the DIRECT version of each Trolley dilemma has a consistently negative and significant coefficient estimate across all models, which supports  14We conducted a probit estimation of the determinants of the decision to opt out of the Trolley dilemma. Though few subjects opted out, we found one variable, “happiness” (self-reported current level of happiness in life) was a marginally significant determinant of the opt-out choice (p .10). Specifically, those self-reporting higher levels of life happiness were marginally more likely to opt out of the Trolley dilemma. 15 Hypothesis H3. Individuals are significantly less likely to take action when it is a more personal moral dilemma (action would be direct) compared to impersonal (action would be indirect). Interestingly, this effect is somewhat muted for male subjects as seen by the significant and positive coefficient on Male*DIRECT in model 5.15 Because many of the dilemmas confound morality of choice with utilitarian actions, we next examine hypothesis H2 using only the subset of Trolley dilemmas (X,Y)=(6,6), (1,1), and (6,0). The comparison of coefficients in our Table 4 estimations are not a transparent way to assess whether a statistically significant number of subjects chose action in the (6,6) and (1,1) dilemmas, or inaction in the (6,0) dilemma. Rather, we can test the null hypothesis that the proportion of subjects choosing action in the (X=Y) dilemmas is equal to zero against the alternative that it is greater than zero. For the test of immoral action, we test the null hypothesis that the proportion of subjects choosing action in the (6,0) dilemma is equal to 100% against the alternative hypothesis that it is less than 100%. For the case of n=138 observations, the observed proportions in both the case of DIRECT andINDIRECT

18 framing of the Trolley dilemmas lie outs
framing of the Trolley dilemmas lie outside of the 95% confidence interval. This evidence implies rejection of H2 in favor of the existence of immoral acts of omission and commission being greater than zero.16Finally, we show support for Hypothesis H1 by using estimates in models (4) and (5) of Table 4. Here the marginal effect on # Lives Sacrificed ) holds constant the # Lives Saved ), and vice versa. Thus, the negative and positive, respectively, effects of these variables on the likelihood of taking action confirm that Trolley choices respond to the relative number of lives saved to lost, which supports Hypothesis 3. In short, action in the Trolley dilemma responds to incentives and displays a downward sloping demand curve for lives saved. Model (6) re-estimates model (5) for the subset of subject who do not display multiple switches in choice across the choice list to highlight that our results are not an artefact of irrational switching behavior in our task design. Nevertheless, a nontrivial number of subjects make choices that can be classified as immoral acts of commission or omission in our unique set of Trolley dilemmas. Having established the results from our Trolley Dilemma, shown them  15This result is somewhat related to the gender result found in Bracht and Zylbersztejn (2018), who find males more likely to take action in a set of moral dilemmas. The study includes a variety of dilemmas in addition to a limited number of Trolley dilemmas, but they do not distinguish dilemmas in their set that involve a direct versus indirect action in the moral choice. As such, our result is an important qualification of what they report given our evidence suggests the gender effect may not be as general as they suggest. 16For the sample proportions tests, the Z statistic cannot be calculated for the boundary hypothesized proportions of 0% and 100%, and so we rather calculate our tests using null hypothesis proportions of 1% and 99%, respectively. Our conclusions remain intact even if allowing for a 5% “error” in decision making (at the .10 level for the (6,6) DIRECT and (6,0) INDIRECT dilemmas, but at the .01 level in all other cases). That is, if assuming that a small percentage of subject may make mistaken choices in our sample, our conclusions regarding the H2 res

19 ult are largely unchanged. 16 consis
ult are largely unchanged. 16 consistent with the extant literature, and also documented our morality metrics as revealing, we next turn to the results from the Money Burning game. 4.2 Money Burning Results Summary results from the Money Burning game are shown in Figures 3 and 4, and in Table 5. Figures 3 and 4 summarize the frequency of money burning choices for the different (x,y) allocation pairs. Figure 3 shows money burning choices in each possible scenario, for both instances of Unilateral Burn and Bilateral Burn. Figure 4 highlights the apparent downward trend in money burning as the cost of burning money is larger relative to the recipient’s budget—money burning also obeys the law of demand (H7). Table 5 shows the total number of instances (out of 9 scenarios) in which the subject burned money, on average (top row), along with summary information on the proportion of money burning choices for the different possible types of money burners. Depending on the relationship between the decider’s payoff, , and the passive recipient’s payoff, , one can consider decisions to burn money reflect disadvantageous inequality aversion (burning money when xy) or nasty preferences (burning money when x .60;䝰 y). Others may never burn money (Homo Economicus or Utilitarian preferences), and some burn money in all 9 scenarios and reveal an unconditional desire to behave antisocially (i.e., destroy resources and reduce total welfare of the pair). Though we have only limited data from deciders in the Unilateral Burn treatments, the Bilateral Burn data in Table 5 reflect similar proportions of burn choices in both Bilateral and Unilateral Burn treatments. This most likely indicates that Bilateral Burn choices are not driven primarily by expectations that others will burn money. We next examine more formal econometric tests of our money burning hypotheses. Tables 6 and 7 show results from Probit estimations of the probability that someone makes the dichotomous choice to burn money and select the End Distribution over the Start Distribution in the Table 2 scenarios. Errors in both tables are clustered at the level of the individual subject, and we report marginal effects in the tables. The set of independent variables in Table 6 includes: controls for the presentation order of the (x,y) distributions in the Money Burning menu set

20 (Random, Increasing, or Decreasing); an
(Random, Increasing, or Decreasing); an indicator variable for the scenarios where burning was Unilateral (Bilateral is the reference group)17; indicator variables capturing  17Appendix C contains a separate robustness estimation of our Table 6 results in Table C1 (Table 6, model (3) is included as model (1) of Table C1). Here, we interact Unilateral Burn with the key immorality variables to establish that, not only is there no main effect difference between money burning tendency among those in Unilateral versus Bilateral Burn, but also that if anything Unilateral Burn participants appear even more likely to burn money if identified as a person of immoral commission. 17 payoff equality/inequality in the different (x,y) payoff distributions; a variable measuring the relative cost of money burning compared to one’s own payoff; a variable measuring the simple utilitarian preference to take action (Action Propensity); a set of subject-specific controls. Importantly, model (3) in Table 6 and the models in Table 7 include indicator variables to identify whether the subject committed Immoral Commission or Immoral Omission in the Trolley problem (6,6), (1,1), and (6,0) dilemmas. So, these two indicator variables capture a sense of the moral preferences of the subject as derived from the Trolley choices, and the test of significance on their coefficients is a test of whether such measures from hypothetical decision scenarios may yet hold power to predict decision in consequential decision tasks than contain at least some type of moral element. Table 7 focuses on estimates separating the subsamples of the data for the (x,y) distributions where x y (disadvantageous payoff inequality)versus x y (advantageous inequality). We first focus on the results in Table 6.18 The statistically insignificant coefficient on the Unilateral Burn indicator variable leads us to reject hypothesis H6—money burning is not greater in Bilateral compared to Unilateral Burn. This suggests that beliefs that others will burn money do not impact money burning decisions in our data. Statistically significant positive coefficients on Incomeother in all three models support rejection of our selfish or utilitarian hypothesis H4 in favor of hypothesis H5 where disadvantageous inequality aversion (Fehr and Schmidt,

21 1999) motivates money burning. The margi
1999) motivates money burning. The marginally significant (p .10) coefficient on the Relative Cost of burning money indicates that money burning is responsive to how much of one’s payoff the burning choice will cost—a lower relative budget impact of burning marginally increases the likelihood that one burns money, which supports hypothesis H7. Model (2) includes an indicator variable for those who opted out of the Trolley dilemma, and we find a marginally significant impact of Opt-Out on the probability that one will burn money. This variable is absent in model (3) where we include the Trolley immorality measures as regressors, which necessarily implies we focus on the money burning data from those who also completed the Trolley dilemma choices. Importantly, in model (3) of Table 6, we find evidence that making a morally dubious choice(s) in the Trolley dilemma predicts a significantly increased likelihood of money burning.19 This is support for hypothesis H8. Thus, we offer first evidence in the literature, to our knowledge, that moral indicators from a hypothetical dilemma can  18 The coefficient estimates on the ordering dummy variables (allocation pairs were presented to different subjects in increasing, decreasing, or random order of one’s own payoff) indicate that there the ordering of the x,y) options as presented to subjects does not matter.19The difference between the impact of Immoral Commission versus Immoral Omission is not statistically significant ( �.10 for the Wald test of coefficient equality) 18 predict significant increases in anti-social money burning choices with real payoff consequences.20 And, importantly, the lack of significance on the coefficient estimate for Action Propensity both Tables 6 and 7 models is a more clean test of whether utilitarianism is linked to antisocial choices. We find that it is not, which contrasts with existing results in the literature (Koenigs et al, 2007; Bartels and Pizarro, 2011; Gao and Tang, 2013; Bracht and Zylbersztejn, 2018 ). In other words, only for those Trolley dilemmas that can identify immorality in a more unambiguous way do we find the connection between Trolley immorality and money burning. Model (5) in Table 6 re-estimates the previous model (4) from the subset of participants who do not d

22 isplay inconsistent switching behavior i
isplay inconsistent switching behavior in their choices. While the estimation precision on the key independent variables is somewhat reduced with this subset of data, our results remain unchanged and are still statistically significant (p .05). Table 7 shows results of related estimations where the subsample of x y versus x y are used as a way to identify general money burning from “nastiness”, which would be defined as a willingness to burn money for payoff distributions (i.e., a willingness to pay to burn money even when my payoff is at least as higher my counterpart’s). The results from Table 7 show that the Diff Income (= |y – x|) represented in the Start Distribution only predicts a significantly higher probability of money burning when a subject’s payoff is lower than the counterpart’s, which again implies rejection of H4 in favor of disadvantageous inequality aversion that is sensitive to the size of inequality. Looking at the advantageous inequalitysubset of data in model (2), we see that the relative cost of burning money marginally matters in terms of anti-social “nasty” choices (p .10). The higher the advantageous payoff inequality is in our design, the lower the relative cost to make the money burning choice. For this reason, we see the predicted marginally higher nastiness in those scenarios where the decider is at the largest payoff advantage (see also right-half of Figure 3). This offers some evidence of nasty preferences as the alternative hypothesis upon rejection of the utilitarian or Homo Economicushypothesis H4. Interestingly, the immorality measures from the Trolley dilemma are significant predictors of the probability one burns money (H8). Model (1) shows that both immoral acts of commission and omission in the Trolley dilemma predict a 36%-38% increase in the likelihood one burns money ( .01 in both cases. The difference between these two effects is statistically insignificant, p .66;酠 .10). We identify predictors of nastiness in model (2) of Table 7 and a key result is that we find that the immoral act of omission in Trolley dilemma #12 (i.e.,  20Model (3) also indicates a marginally significant impact of higher self-reported life happiness predicting a lower probability that one burns money. 19 not acting when 6 lives could be s

23 aved at the expense of zero lost lives)
aved at the expense of zero lost lives) predicts a 30% increased likelihood of making a “nasty” money burning choice (p .01). In a sense, our strongest way to judge morality from the Trolley dilemma is whether someone chose the immoral act of omission. In sum, we find strong support for hypothesis H8 and conclude that Trolley morality, though hypothetical, can be a significant predictor of consequential antisocial decisions. 5. Discussion. Economists have long challenged the assumption of homo economicus and recognize that people are not always own-payoff maximizing. Rather, they may be altruistic, fairness-minded, cooperative, or perhaps even anti-social. Using laboratory methods with real payoff, experimental economics has shown that participants in dictator games often share their endowment (Forsythe et al, 1994; Hoffman et al, 1994), they reciprocate in gift exchange or trust environments (Berg et al, 1995; Fehr et al, 1998), and they contribute positive amounts in public goods games (see surveys in Ledyard, 1995; Chaudhuri, 2011). Studies focusing on the darker side of human behaviour are remarkebly more limited in economics. This is all the more surprising given that unethical behaviour within organizations is not rare and often results in high costs for the entire society. Anti-social behaviours, in general, can result in relational, workplace, or other costs to society that are nontrivial. In this paper we attempted to identify some key determinants of costly antisocial behaviours using measures derived from both a money burning game and a moral thought experiment. While ethical dilemmas and thought experiments have been of significant interest to moral philosophers for decades, we believe our study to be unique. Our particular innovation has been to use responses in the iconic Trolley dilemma to generate immorality indicators that have predictive power regarding one’s decisions in consequential environments. The consequential environment we explore allows for costly antisocial choice and may be considered a type of behavioural marker for the likelihood of costly actions in field settings. Our results highlight the importance of the relative cost of the ethical behaviour across the domains of both the hypothetical Trolley dilemma and the consequential Money Burning game. Subjects are more likely to make an ethically dubious

24 choice if the costs of doing so are lowe
choice if the costs of doing so are lower. Aside from identifying typical response patterns in the Trolley dilemma, we identified choices made from our set of Trolley dilemmas that would constitute morally questionable acts of omission or commission. We then estimated a significant increase in the likelihood of burning money for those subjects identified as willing to commit an immoral act of omission or commission in the Trolley dilemma. Upon further investigation, we found that the immoral 20 Trolley respondents’ increased willingness to burn money was linked more strongly to disadvantageous inequality aversion than to nastiness. Nevertheless, we identified that choice in one Trolley scenario (not typically considered in the existing literature) is a highly significant predictor of the probability of nasty money burning. These results call into question some recent conclusions in the literature regarding increased Utilitarianism among those with anti-social personality traits (Koenigs et al, 2007; Bartels and Pizarro, 2011; Gao and Tang, 2013; Bracht and Zylbersztejn, 2018). Specifically, our research connects immoral, rather than utilitarian, choices to anti-social behaviour in a stylized game. As always, there are limitations to our study. First, it is likely the case that reputational concerns may be important if one is aware that selection in some field setting (e.g., hiring choice) based on Trolley dilemma responses may be at stake. And of course, the validity of a hypothetical ethical dilemma may always be a point of concern. For this reason, one of our main purposes is to highlight that response patterns in such hypothetical dilemmas may be instructive towards an understanding of consequential behavioural tendencies. At some level, the criticism of selection bias would apply to any number of hypothetical or self-response instruments used to screen individuals or assess situational risk. We believe the key is that we first understand the link between hypothetical responses and consequential behaviours, because researchers often have no alternative approach to study high stakes choices in the moral domain. Our hope is that this research will stimulate further investigations into the value of hypothetical choices towards predicting outcomes in other non-hypothetical but related decision domains. These findings m

25 ay have interesting implications for how
ay have interesting implications for how hypothetical scenario instruments could be used to screen individuals for antisocial tendencies that could be costly to an organization. Because the type of anti-social decision making we studied involves resource destruction when outcome inequality is present, it is intriguing to consider that the markers for such behavioural tendencies may already exist in well-known hypothetical thought scenarios. Imagine that an employer could use responses to the Trolley dilemma as a way to identify workers who may be more willing to engage in antisocial resource destruction. While this may seem like the type of worker to avoid (i.e., do not hire such individuals in designing self-driving auto accident avoidance algorithms), those willing to destroy resources in a way that is not anti-social may have value to the employer in certain specialized roles (e.g., lead negotiator who must credibly be willing to walk away from a contractual arrangement or wage negotiations). Our results may therefore be useful in identifying the benefits of improved screening in matching markets, in general. For example, previous studies would have suggested employers 21 hire a “utilitarian”, as identified by a moral dilemma battery, a suitable candidate to positions requiring difficult but necessary decisions. However, our results show reason for caution as these utilitarians might be masking underlying antisocial tendencies that would be destructive in the organization but cannot be separately identified using traditional a traditional behavioral questionnaire. As an alternative example, consider how improved screening in online dating markets may use creative approaches to identify desirable traits that are not unintentionally confounded with antisocial traits. For example, generic leadership suitability questions may be inadequate as they capture both desirable leadership qualities as well as antisocial tendencies that may appear disproportionately in certain leadership context (see Landay et al, 2015, regarding psychopathy and leadership). Of course, such implications of our findings are themselves only a thought experiment, but we hope them to be useful at motivating why this may be a fruitful area for research extensions. If choices in hypothetical dilemmas can serve as behavioural markers that predict real world et

26 hical choice, then we feel this is a use
hical choice, then we feel this is a useful step forward in an important area of behavioural research. Additionally, current technological developments (e.g. the utilization of drones and self-driving vehicles) render hypothetical moral dilemmas like the Trolley dilemma increasingly relevant to policy-makers as society attempts to understand barriers to technology adoption and implementation (e.g., Crockett, 2016). Our results have implications for how choices in hypothetical moral dilemmas may be used to understand or even possibly forecast certain types of behaviour in real world environments. REFERENCES Abbink K, & Herrmann B (2011). The moral costs of nastiness. Economic Inquiry, 49(2): 631-633. Abbink K, & Sadrieh A. (2009): The pleasure of being nasty. Economics Letters, 105: 306-308. Anderson CM, & Putterman L. (2006). Do non-strategic sanctions obey the law of demand? The demand for punishment in the voluntary contribution mechanism. Games and Economic Behaviour, 54(1): 1-24. Awad E, Dsouza S, Kim R, Schulz J, Henrich J, Shariff A, Bonnefon JF, & Rahwan I (2018). The Moral Machine experiment. Nature, 563(7729): 59. Bauman CW, McGraw AP, Bartels DM, & Warren C (2014). Revisiting external validity: Concerns about trolley problems and other sacrificial dilemmas in moral psychology. Social and Personality Psychology Compass, (9): 536-554. 22 Bartels DM, Bauman, CW, Cushman FA, Pizarro DA, & McGraw AP. (2015). Moral judgment and decision making.” In G. Keren & G. Wu (Eds) The Wiley Blackwell Handbook of Judgment and Decision Making Chichester, UK: Wiley Bartels DM, & Pizarro DA. (2011). The mismeasure of morals: Antisocial personality traits predict utilitarian responses to moral dilemmas. Cognition, 121: 154-161. Becker GS (1968). Crime and punishment: An economic approach. In The economic dimensions of crime (pp. 13-68). Palgrave Macmillan, London. Bentham J. [1789] 1962. An Introduction to the Principles of Morals and Legislation In John Bowring (ed.), Vol. 1 of The Works of Jeremy Bentham, New York: Russel & Russel Berg J, Dickhaut J., & McCabe K. (1995). Trust, reciprocity, and social history. Games and Economic Behaviour, 10(1): 122-142. Bonnefon JF, Shariff A, & Rahwan I (2016). The social dilemma of autonomous vehicles. Science, 352(6293): 1573-1576. Bostyn, DH, Sevenhant S, & Roets A (2018). Of

27 mice, men, and trolleys: hypothetical j
mice, men, and trolleys: hypothetical judgment versus real-life behaviour in trolley-style moral dilemmas. Psychological Science, 29(7): 1084-1093. Bracht J, & Zylbersztejn A (2018). Moral judgments, gender, and antisocial preferences: an experimental study. Theory and Decision, 85(3-4) : 389-406. Brandts J, & Charness G (2011). The strategy versus the direct-response method: a first survey of experimental comparisons. Experimental Economics, 14(3): 375-398. Brekke K, Kverndokk S, & Nyborg K. (2003). An economic model of moral motivation, Journal of Public Economics87, 1967–1983. Bruner DM. 2009. Changing the probability versus changing the reward. Experimental Economics, 12(4): 367-385. Carney DR, & Mason MF (2010). Decision making and testosterone: when the ends justify the means. Journal of Experimental Social Psychology, 46(4), 668-671. Charness G, Masclet D, & Villeval MC (2013). The dark side of competition for status. Management Science, 60(1): 38-55. Chaudhuri A (2011). Sustaining cooperation in laboratory public goods experiments: a selective survey of the literature. Experimental Economics, 14(1): 47-83. Cima M, Tonnaer F, Hauser MD (2010) Psychopaths know right from wrong but don’t care. Social cognitive and affective neuroscience, (1): 59-67. Cox JC, Servátka M, & Vadovi R (2017). Status quo effects in fairness games: reciprocal responses to acts of commission versus acts of omission. Experimental Economics, 20(1): 1-18. Crockett M (2016). The trolley problem: Would you kill one person to save many others? The Guardian, Dec. 12, 2016. Cushman F, Young L, & Hauser M (2006). The role of conscious reasoning and intuition in moral judgments: Testing three principles of harm. Psychological Science,17: 1082–1089. 23 Dickinson DL, Masclet D, & Peterle E. (2018) Discrimination as favoritism: The private benefits and social costs of in-group favoritism in an experiment labor market. European Economic Review, 104 (May): 220-236. Fehr E, & Gächter S (2002). Altruistic punishment in humans. Nature, 415(6868), 137. Fehr E, & Gächter (2000). Cooperation and punishment in public goods experiments. American Economic Review, 90(4): 980-994. Fehr E, Kirchsteiger G, & Riedl A (1998). Gift exchange and reciprocity in competitive experimental markets. European Economic Review, 42(1): 1-34. Fehr E, & Schmidt KM (1

28 999): A theory of fairness, competition
999): A theory of fairness, competition and cooperation. Quarterly Journal of Economics, 114: 817-868. Figuieres C, Masclet D, & Willinger M (2013) Weak Moral Motivation leads to the Decline of Voluntary Contributions. Journal of Public Economic Theory, 15(5): 745-772. Foot P (1967). The problem of abortion and the doctrine of the double effect, Oxford Review, : 5-15. Forsythe R, Horowitz JL, Savin NE, & Sefton M (1994). Fairness in simple bargaining experiments. Games and Economic Behaviour, (3): 347-369. Gao Y, & Tang S (2013). Psychopathic personality and utilitarian moral judgment in college students. Journal of Criminal Justice, 41(5): 342-349. Greene JD, Cushman FA, Steward LE, Lowerberg K, Nystrom LE, & Cohen JD (2009). Pushing moral buttons: The interaction between personal force and intention in moral judgment. Cognition, 111: 364-371. Greene JD, Sommerville RB, Nystrom LE, Darley JM, & Cohen JD (2001). An fMRI investigation of emotional engagement in moral judgment. Science, 293(5537): 2105–2108.  Harsanyi J (1980) “Rule Utilitarianism, rights, obligations and the theory of rational behaviour, Theory and Decision, 12: 115-133. Hoffman E, McCabe K., Shachat K., & Smith V (1994). Preferences, property rights, and anonymity in bargaining games. Games and Economic Behaviour, (3): 346-380. Holt CA, & Laury SK. (2002). Risk aversion and incentive effects. American Economic Review, 92(5): 1644-1657. Kahane G (2015). Sidetracked by trolleys: Why sacrificial moral dilemmas tell us little (or nothing) about utilitarian judgment. Social Neuroscience, 10(5): 551-560. Kandel E, & Lazear E 1992. Peer pressure and partnership. Journal of Political Economy100: 801-817. Kant Immanuel. “On a Supposed Right to Lie from Benevolent Motives,” 1787, in Lewis W. Beck, ed., The critique of practical reason and other writings in moral philosophy. Chicago: University of Chicago Press, 1949, pp.346 –50. Koenigs M., Young L, Adolphs R, Tranel D, Cushman F, Hauser M, & Damasio A (2007). Damage to the prefrontal cortex increases utilitarian moral judgments. Nature, 446(7138): 908-911. 24 Laffont JJ. (1975) Macroeconomic constraints, economic efficiency and ethics: An introduction to Kantian Economics, Economica, 42: 430-437. Landay K, Harms P, & Credé M (2019). Shall we serve the dark lords? A meta-analytic review of psyc

29 hopathy and leadership. Journal of Appli
hopathy and leadership. Journal of Applied Psychology, 104(1): 183-196. Lazear E (1989), "Pay equality and industrial politics," Journal of Political Economy, 97(3), 561-580. Ledyard J (1995) Public goods: A survey of experimental research. In J. Kagel, A. Roth (Eds.), The Handbook of Experimental Economics, Princeton Univ. Press, Princeton: 111-194. Line MB, Zand A, Stringhini G, & Kemmerer R (2014). Targeted attacks against industrial control systems: Is the power industry prepared? In Proceedings of the 2nd Workshop on Smart Energy Grid Security, November (2014): 13-22. ACM. Mill, John Stuart. [1861] 1998.L’Utilitarisme. Paris: PUF. Navarrete CD, McDonald MM, Mott ML. & Asher B (2012). Virtual morality: Emotion and action in a simulated three-dimensional “trolley problem”. Emotion, 12(2) : 364-370. Nikiforakis N, & Normann HT (2008). A comparative statics analysis of punishment in public-good experiments. Experimental Economics, 11(4): 358-369. Nyborg K (2000) Homo economicus and homo politicus: Interpretation and aggregation of environmental values, Journal of Economic Behaviour and Organization 42: 305–322. New York Time (1995) Morality, Reduced To Arithmetic, August 1995 Petrinovich L, O’Neill P, & Jorgensen M (1993). An empirical study of moral intuitions: Toward an evolutionary ethics. Journal of Personality and Social Psychology, 64: 467–478. Rai TS, & Holyoak KJ (2010). Moral principles or consumer preferences? Alternative framings of the trolley problem. Cognitive Science, 34: 311–321. Shallow C, Iliev R., & Medin D (2011). Trolley problems in context. Judgment and Decision Making, (7): 593-601. Smith, Adam. (1759) [1981]. The Theory of Moral Sentiments. D. D. Raphael and A. L. Macfie, eds. Liberty Fund: Indianapolis. Spranca M, Minsk E, & Baron J. (1991). Omission and commission in judgment and choice. Journal of Experimental Social Psychology,27: 76–105. Thomson J (1985). The Trolley Problem, Yale Law Journal, 94: 1395–1415. Twenge JM, & Foster JD (2010). Birth cohort increases in narcissistic personality traits among American college students, 1982–2009. Social Psychological and Personality Science, (1): 99-106. Werner KB, Few LR, & Bucholz KK (2015). Epidemiology, comorbidity, and behavioral genetics of antisocial personality disorder and psychopathy. Psychiatric Annals, 45(4): 195-199. Zizzo

30 D (2004): Inequality and Procedural Fair
D (2004): Inequality and Procedural Fairness in a Money Burning and Stealing Experiment. In F.A. Cowell (ed.), Research on Economic Inequality, vol. 11. Elsevier. Zizzo D, & Oswald AJ (2001): Are People Willing to Pay to Reduce Others’ Incomes? Annales d’Economie et de Statistique 63-64: 39-62. 25 Table 1. Trolley Dilemmas. INDIRECT DIRECT Are you willing to pull a lever to divert the trolley to a different track to save X people, where Y on that side track will die. Are you willing to kill Y people by pushing them onto the track to save X people? Trolley Dilemma # Total people killed Total people saved Total people killed Total people saved 1 Y=6 X=6 Yes No Y=6 X=6 Yes No 2 Y=5 X=6 Yes No Y=5 X=6 Yes No 3 Y=4 X=6 Yes No Y=4 X=6 Yes No 4 Y=3 X=6 Yes No Y=3 X=6 Yes No 5 Y=2 X=6 Yes No Y=2 X=6 Yes No 6 Y=1 X=6 Yes No Y=1 X=6 Yes No 7 Y=1 X=5 Yes No Y=1 X=5 Yes No 8 Y=1 X=4 Yes No Y=1 X=4 Yes No 9 Y=1 X=3 Yes No Y=1 X=3 Yes No 10 Y=1 X=2 Yes No Y=1 X=2 Yes No 11 Y=1 X=1 Yes No Y=1 X=1 Yes No 12 Y=0 X=6 Yes No Y=0 X=6 Yes No Note: Trolley dilemmas numbered here for discussion in the text (dilemmas were not numbered for subjects) Table 2: Money Burning choice tasks (Increasing treatment) Subjects chose the Start or End Distribution for each of the 9 tasks Task # Start Distribution Damage Burning costs End Distribution A1 (50 , 250) 50 10 (40 , 200) A2 (50 , 200) 50 10 (40 , 150) A3 (50 , 150) 50 10 (40 , 100) A4 (50 , 100) 50 10 (40 , 50) A5 (50 , 50) 50 10 (40 , 0) A6 (100 , 50) 50 10 (90 , 0) A7 (150 , 50) 50 10 (140 , 0) A8 (200 , 50) 50 10 (190 , 0) A9 (250 , 50) 50 10 (240 , 0) 26 Table 3. Summary of the Money Burning TreatmentsSession Participants Treatment Description 1 18 Increasing—Unilateral burn 2 16 Increasing—Bilateral burn 3 18 Increasing—Bilateral burn 4 18 Decreasing—Unilateral burn 5 16 Decreasing—Bilateral burn 6 14 Decreasing—Bilateral burn 7 18 Random—Unilateral burn 8 16 Random—Bilateral burn 9 16 Random—Bilateral burn Total 150 (n=96 Bilateral Burn, n=54 Unilateral burn) 27 Table 4. Probability of Action (Pull level or Push person) in Trolley DilemmaMarginal Effects Reported (robust st errors in parenthesis) Independent variable (1) All (2) All (3) All (4) All (5) All (6) No-Switch^ DIRECT Action -0.2061*** (0.0314) -0.2083*** (0.031

31 7) -0.1917*** (0.0302) -0.1997*** (0
7) -0.1917*** (0.0302) -0.1997*** (0.0305) -0.2974*** (0.0502) -3054*** (0.0507) MaleDIRECT --- --- --- --- 0.1863*** (0.0570) 0.1932*** (0.0576) (X,Y)=(6,0) Reference Reference --- --- --- --- (X,Y)=(6,6) -0.6207*** (0.0263) -0.6243*** (0.0268) --- --- --- --- (X,Y)=(6,5) -0.3996*** (0.0422) -0.4026*** (0.0427) --- --- --- --- (X,Y)=(6,4) -0.3765** (0.0448) -0.3794*** (0.0454) --- --- --- --- (X,Y)=(6,3) -0.3298*** (0.0488) -0.3324*** (0.0495) --- --- --- --- (X,Y)=(6,2) -0.3095*** (0.0495) -0.3120*** (0.0503) --- --- --- --- (X,Y)=(6,1) -0.2391*** (0.0529) -0.2403*** (0.0542) --- --- --- --- (X,Y)=(5,1) -0.2547*** (0.0508) -0.2570*** (0.0517) --- --- --- --- (X,Y)=(4,1) -0.2851*** (0.0468) -0.2877*** (0.0476) --- --- --- --- (X,Y)=(3,1) -0.2991*** (0.0472) -0.3019*** (0.0478) --- --- --- --- (X,Y)=(2,1) -0.3329*** (0.0443) -0.3359*** (0.0449) --- --- --- --- (X,Y)=(1,1) -0.5839*** (0.0266) -0.5881*** (0.0268) --- --- --- --- # Lives Sacrificed (Y) --- --- -0.1102*** (0.0073) -0.1117*** (0.0072) -0.1126*** (0.0073) -0.1161*** (0.0070) # Lives Saved (X) --- --- 0.0873*** (0.0062) 0.0885*** (0.0061) 0.0892*** (0.0062) 0.0909*** (0.0060) Religion  [1 ,10] (10=very important) --- -0.0026 (0.0118) --- -0.0022 (0.0113) -0.0023 (0.0114) -0.0027 (0.011) Happiness  [1 ,10] (10=highest current life happiness)--- 0.0205 (0.0204) --- 0.0196 (0.0196) 0.0198 (0.0197) 0.0200 (0.0198) Age --- 0.0289 (0.0187) --- 0.0271 (0.0178) 0.0270 (0.0178) 0.0278 (0.0181) Male (=1) 0.1020* (0.0599) --- 0.0979* (0.0576) -0.0013 (0.0657) -0.0025 (0.0668) Observations 3312 3312 3312 3312 3312 3264 #Clusters 138 138 138 138 138 136^ Log likelihood -1921.8550 -1889.6102 -1998.7432 -1968.3391 -1954.1628 -1911.9069 Notes: *.10, **.05, ***.001 for the 2-tailed test. Standard errors clustered at the individual subject level.Total observations reflect n=138 subjects who opted to complete the Trolley dilemma task. Each of the 138 made 12 Direct and 12 Indirect Trolley dilemma choices. ^Reduced by subject who inconsistently switched choices in the Trolley Dilemma. 28 Table 5: Descriptive statistics of money burning decisions All Unilateral Burn Bilateral Burn # Money Burning choices (out of 9) Mean [standard deviation] 1.33 [2.11]1.22[1.82]1.35[2.19] Never burn Homo Economicus or Utilitarian82 (66.6

32 7%) 18 (66.67%) 64 (66.67%) Burn only w
7%) 18 (66.67%) 64 (66.67%) Burn only when income other’s Disadvantageous inequality aversion) 6 (4.87%) 2 (7.40%) 4 (4.17%) Burn only when income other’s Pure nastiness) 19 (15.45%) 4 (14.81%) 15 (15.62%) Always burn Unconditionally anti-social) 2 (1.63%) 0 (0%) 2 (2.08%) Other 14 (11.38%) 3 (11.12%) 11 (11.46%) Total # Subjects 123 27 96 Notes: # subjects in bold, % subjects in parenthesis ( ) 29 Table 6. Probability of burning money Independent Variable (1) Marg. Effect (st. error) (2) Marg. Effect (st. error) (3) Marg. Effect (st. error) (4) Marg. Effect (st. error) All All All No-Switch^^ Increasing (x,y) order (=1) -0.0077 (0.0502) -0.0047 (0.0498) -0.0196 (0.0510) -0.0065 (0.0514) Decreasing (x,y) order (=1) -0.0186 (0.0467) -0.0173 (0.0460) -0.0147 (0.0493) -0.0201 (0.0524) Unilateral Burn (=1) -0.0146 (0.0456) -0.0110 (0.0454) -0.0156 (0.0440) -0.0348 (0.0417) |Income other (x y)| 0.0005*** (0.0001) 0.0005*** (0.0003) 0.0005*** (.0002) 0.0005*** (.0002) Income .60;䝰 other (x .60;䝰 y) -0.0002 (0.0003) -0.0002 (0.0003) -0.0002 (0.0003) -0.0001 (0.0003) Income = other ( = 1) 0.0525 (0.0524) 0.0513 (0.0519) 0.0597 (0.0583) 0.0866 (0.0617) Relative cost -0.9551* (0.5447) -0.9398* (0.5370) -1.0741* (0.5787) -1.0033  (0.6175) Trolley Opt-Out (=1) --- -0.1171* (0.0409) --- Action Propensity (Trolley dilemmas 2-10) --- --- 0.0675 (0.0546) 0.0723 (0.0526) Immoral Commission (=1) (action in Trolley 1&11) --- --- 0.2655*** (0.1154) 0.2188** (0.1360) Immoral Omission (=1) (inaction in Trolley 12) --- --- 0.3428*** (0.1282) 0.3178** (0.1802) Male (=1) --- --- -0.0157 (0.0433) -0.0238 (0.0430) Happiness  [1 ,10] (10=highest current life happiness) --- --- -0.0278* (0.0161) -0.0292* (0.0154) Religion  [1 ,10] (10=very important) --- --- 0.0053 (0.0078) 0.0023 (0.0075) Age --- --- -0.0135 (0.0133) -0.0100 (0.0127) Observations 1107 1107 1026 972 # Participants^ 123 123 114^ 108^^ Log likelihood -458.2919 -452.741 -406.183 -362.746 Notes: *.10, **.05, ***.001 for the 2-tailed test. Standard errors clustered at the individual subject level. Increasing, Decreasing, Random (reference group) control for the order of the money burning allocation scenarios. Relative Cost = the 10 experimental monetary units (EMU) cost divided by the payoff in EMU if choosing not to burn money. Trolley Opt-Out = 1 if subjec

33 t chose not to complete the Trolley dile
t chose not to complete the Trolley dilemma task. ^reduced as a result of those opting out of the Trolley dilemma choice, which is used to score morality variables. ^^reduced by number of subjects who inconsistently switched choices in the money burning task. 30 Table 7. Probability of burning money Marginal Effect (st. error) displayed Independent Variable (1) Income other’s (2) Income other’s Increasing (x,y) order (=1) 0.0546 (0.0705) -0.0665 (0.0574) Decreasing (x,y) order (=1) 0.0312 (0.0649) -0.0510 (0.0597) Unilateral Burn (=1) -0.0326 (0.0527) -0.0123 (0.0569) |Diff Income| 0.0004*** (0.0001) 0.0007 (0.0005) Equal Income (x = y) 0.0513 (0.0509) 0.2075 (0.1820) Relative cost --- -2.3937* (1.3978) Action Propensity (Trolley dilemmas 2-10) 0.0379 (0.0572) 0.1121 (0.0717) Immoral Commission (=1) (action in Trolley 1&11) 0.3669*** (0.1797) 0.1326 (0.1146) Immoral Omission (=1) (inaction in Trolley 12) 0.3823*** (0.1774) 0.3043*** (0.1387) Male (=1) 0.0084 (0.0527) -0.0441 (0.0541) Happiness  [1 ,10] (10=highest current life happiness) -0.0203 (0.0172) -0.0357* (0.0195) Religion  [1 ,10] (10=very important) 0.0085 (0.0092) -0.0071 (0.0102) Age -0.0211 (0.0151) -0.0105 (0.0176) Observations 570 570 # Participants^ 114 114 Log likelihood -196.646 -239.281 Notes: *.10, **.05, ***.001 for the 2-tailed test. Standard errors clustered at the individual subject level.^reduced as a result of those opting out of the Trolley dilemma choice, which is used to score morality variables. 31 Figure 1. Frequencies of taking action in the Trolley dilemma by treatment (number saved unchanged) Notes: (X,Y) dilemmas represent number saved (X) and number sacrificed (Y) Figure 2. Frequencies of taking action in the Trolley dilemma by treatment (number killed unchanged) Notes: (X,Y) dilemmas represent number saved (X) and number sacrificed (Y) 0 .2 .4 .6 .8 1 (6,0)(6,1)(6,2)(6,3)(6,4)(6,5)(6,6) IndirectDirect 0 .2 .4 .6 .8 1 (6,1)(5,1)(4,1)(3,1)(2,1)(1,1) IndirectDirect 32 Figure 3. Frequencies of money burning decision by treatment  \r \r \n  Figure 4. Money burning per relative cost   \r   \r    \r     \r       \r   \r 

34  \r   \r \r  
 \r   \r \r     \r   \r     0 .05 .1 .15 .2Frequency of money burning 50-25050-20050 -15050-10050-50100-50150-50200-50250-50 Both burnOnly one burns 0 .05 .1 .15 .2 10/25010/20010/15010/10010/50 Bilateral burnUnilateral burn 33 Appendix A: Experiment Instructions MONEY BURNING GAME INSTRUCTIONS The following instructions are translated from French. These are for the Unilateral burn treatment (table presents allocation pairs (x,y) in an increasing order). The instructions for the other treatments are available from the authors upon request. You are participating in an economics experiment during which you can earn money. It is therefore important to read these instructions carefully. All earnings in this experiment will be expressed in terms of ECU (Experimental Currency Units). At the end of the sessions, these earnings will be converted to Euros as follows: 8 points = 1 Euro You will also receive a show-up fee of 8 Euros At the beginning of the experiment, you will be randomly assigned a role: A or B. Therefore, you will be either a player of type A or of type B. You will keep the same role during the entire experiment. Description of the Game Suppose you are player A You will be randomly matched with a player B in the room. A table as shown below will appear on your screen. For each row of the table you will have to answer the following question (yes or no): « You receive an endowment of x points. Player B receive an endowment of y points. You have the opportunity to reduce player B’s endowment by 50 points, which will cost you 10 points. In this case, you will get x-10 points and the other player will get 50 points. » Do you want to reduce player B’s payoff?Each row of the table corresponds to a particular value of and . Once you have filed out the entire table, the computer will randomly choose a row of the table that will determinate your payoff as well as player B’s payoff. At the end, you will observe your payoff and player B’s payoff. Your payoff is calculated as follow: x-cost of reduced points for player B. 34 In addition you receive a show up fee of 8 euros. Example 1: suppose that row 5 is randomly chosen and that for this row you had decided to reduce player B’s payoff, then your payoff is 50-10=40. Example 2: suppose that ro

35 w 5 is randomly chosen and that for this
w 5 is randomly chosen and that for this row you had decided not to reduce player B’s payoff, then your payoff is 50. Suppose you are player B You will be randomly matched with a player A in the room. In this game you have no decision to take and it is player A’s decision that will determine your payoff. Once player A has filed out the entire table, the computer will randomly choose a row of the table that will determinate player A’s payoff as well as your payoff. At the end, you will observe your payoff and player A’s payoff. Your payoff is calculated as follows: x- reduced points by player A In addition you receive a show up fee of 8 euros. Example 1: suppose that row 5 is randomly chosen and that for this row player A had decided to reduce player B’s payoff, then your payoff is 0. Example 2: suppose that row 5 is randomly chosen and that for this row player A had decided not to reduce player B’s payoff, then your payoff is 50. One row of the table will be randomly chosen to determine payoffs in this experiment If you have any question regarding the instructions, please raise your hand. We will answer your questions in private. --------------------------------------------------------------------------------------------------------------------------- TROLLEY DILEMMA INSTRUCTIONS The following instructions are translated from French (Note: participants could opt out of this task)A runaway trolley will kill X persons on the track. You have the option to act to save these X people. The table below describes different scenarios where each row corresponds to particular values of X and Y. In the left part of the table, you have the possibility to pull a lever to divert the trolley to a different track. In this case, the train will run onto a different track on which there are Y people who will die. You have to answer yes or no to the following question: Are you willing to pull a lever to divert the trolley to a different track where Y on that side track will die to save X people on the main track? In the right part of the table, you have the possibility to push onto the main track Y people who will be killed by the train but yet stop the train. You have to answer yes or no to the following question: Are you willing to kill Y people by pushing them onto the side track to save X people on the main track? Note that you also have the oppor

36 tunity to not answer these questions by
tunity to not answer these questions by clicking on the button below the table. (Table shown on next page) 35 36 Appendix B: Comparative Static Predictions (theoretical framework)We present a theoretical model that introduces considerations for intrinsic moral obligations in the utility function (e.g., Nyborg, 2000; Brekke, Kverndokk, and Nyborg, 2003; Figuieres et al., 2013; Dickinson et al., 2018). Precisely we enrich the agent’s utility function by introducing a function of moral motivation. Recall that utility in our behavioural model with moral obligation was defined as:  \n (1) where a, is an action that generates both benefits, , and costs, .  is a non-monetary moral function where  describes one’s moral imperative such that any deviation from this moral standard of action, , generates disutility. We assume b’ � 0, c’ � 0, b’’ 0, ’’ .66;酠 0, such that utility benefits and costs are increasing in the action, and benefits increase at a decreasing rate while costs increase at an increasing rate. The disutility of deviations from one’s moral ideal are captured by assuming v’ .66;酠 0 if  , v’ 0 if  \r We also assume that v’’ .66;酠 0 such that marginal disutility increases at an increasing rate as one’s action gets further from the moral obligation. Note that an “action” here is quite general. Following Figuieres et al (2013), we assume that moral motivation is weak in the sense that it can be influenced by others’ activities or expectation of others’ activities. Precisely, we conceptualize the weak moral motivation (or obligation) of each agent as a combination of three arguments:i) an autonomous obligation denoted i a [0, 1], ii) a social influence argument , i a - and iii) fairness considerations captured by a composite variable . The autonomous logic is captured by an ideal, or “ethical,” level noted i a [0, 1]. Such an autonomous morality can be grounded on a Kantian categorical imperative, or on an unconditional commitment to a contribution (Laffont, 1975; Harsanyi, 1980). The second argument captures social influences through either the observation of others’ unethical activities and/or beliefs about others’ actions , i a - . Finally, the third argument, noted [- i a , i a ], captures fairness considerations in a broad defin

37 ition (Rabin, 1993; Fehr and Schmidt, 19
ition (Rabin, 1993; Fehr and Schmidt, 1999) that can affect moral motivation; it includes feeling of being treated badly (well) by others but also feeling of being badly (well) treated by the Nature in term of bad/good luck. Depending on the nature of the action , the value of parameter may be either positive or negative. Precisely, if a person feels he is treated badly (kindly) by others or by the nature, he may revise downward (upward) her moral ideal obligation. 21 Accordingly, following Figuieres et al., (2013), we then define strong moral motivation as an unconditional commitment to stick to one’s ideal moral target. In contrast, weak moral motivation refers to one’s sensitivity to the observation/expectation of others’ actions, which can lead to a revision of one’s moral ideal target. Overall, the qualified moral  For instance,imagine the case of a dictator game played twice. Suppose that player is the dictator and player j is the receiver in period 1. In period 2, the role are reversed. Suppose also that player i keeps all his endowment for himself in period 1. In absence of information regarding the issue of the game player during the first period, player will choose his ideal amount sent to player based on his ideal moral obligation, . Suppose now that player is informed of player ‘s decision in period 1 before taking his decision. Then he may revise downward his decision because he feels he is badly treated by player (z 0). But player may also feel badly treated by nature if for instance, player i’s decision in period 1 in term of allocation of wealth is replaced by a random allocation. In this case, it is also possible that player may revise downward her decision by the simple fact of being badly treated by nature. The extent of such a revision of moral motivation typically varies across individuals: strongly morally motivated agents will closely stick to their ideal target, whereas weakly motivated agents are prone to revise their morally 37 obligation, i a can be defined as a function of the aforementioned variables:  , (,,) iii aaaaz . We assume that   , 0,0 and 0 iiiaaaaz¶¶¶ ³³³ ¶¶Individuals choose action, , to maximize utility, yielding the following first order condition:   \n ! "This can be solved for the optimal act

38 ion level  such that the following
ion level  such that the following identity holds: \n!" #!#"From this we can derive the comparative static result of interest by differentiating with respect to one’s moral obligation:  \n  %& (4) This can be solved for:  '(**'+**'(  (5) Thus, the optimal level of action is positively linked to one’s moral obligation in the decision scenario. 3.1. Trolley Problem Proof of H1: Let’s consider the following maximization problem without the morality argument, in the utility function, and assuming multiple and separable benefits and costs of one’s action (this may facilitate consideration of each live saved or lost in the Trolley dilemma): ,-134534 (6) where 134 corresponds to the aggregate benefits in term of lives saved when taking action, i, and534 is the aggregate cost in terms of lives sacrificed. From (6) we have the following first order condition:  78 ,\n (7) Assuming that b’=c’, such that the marginal value of a saved life equals the marginal cost of a sacrificed life, then a utilitarian should always choose action as long as n � and should abstain from acting otherwise.  ideal target whenever they observe or anticipate a gap between their own and others’ money burning decisions. Our idea is that most people are of the “mixed” type, i.e., their actual moral target is the outcome of a deliberative process through which their preferred moral target is balanced against others’ anticipate level of money burning. 38 Let’s now relax some assumption and consider the case of agents with moral concerns represented by the following utility function (indexing v by the lives lost allows the moral imperative to potentially differ across lives sacrificed). ,-134534/5534 (8) From (8) we derive the first-order condition (F.O.C.):  78 ,\n 9, (9)Equation (9) indicates that there is now an additional marginal cost , to sacrifice lives and that cost may counterbalance the utilitarian calculus described above in equation (6). Depending on the individual weight of moral concern in the utility function, it is now unclear the best action to maximize utility. Indeed, if the marginal moral cost of taking action that sacrifices m lives in order to save n lives o

39 utweighs what would otherwise be a net g
utweighs what would otherwise be a net gain in utility, 8 ,\n , then the individual will abstain from acting. This condition may also be written as 8 ,9 , which highlights that the relevant comparison is now the sum of all marginal benefits relative to the sum of all costs (traditional plus moral costs). It is clear from (9) that the likelihood of acting will increase in the number of lives saved, , holding constant. Proof of H2: the specific dilemma in the trolley problem where lives lost are unaffected (X=Y dilemmas) corresponds to the case in our model where equals . Assuming b’c’ (otherwise, some lives matter more than others, which is a clear extension of this model), the F.O.C. in (9) reduces to 0 = mv’. This condition is only met when the individual makes a choice precisely at one’s moral obligation,  Only agents endorsed with more immoral or nasty preferences would be inclined to take action here since the moral obligation is to be actively responsible for the lives lost, rather than passively allow a similar number of deaths. This could be interpreted in our model as having a relatively high  parameter (since by nature,  close to zero means a highly moral agent) such that  v’0. In such case, there is a gain to increase action, , such that the moral cost of deviating from one’s target will decrease. Let’s now consider the (6,0) Trolley dilemma, where action costs no lives. In such case, c’=0 and =0. Here, there are no longer moral costs of lives lost since no one dies in the (6,0) dilemma, so inaction is only justified if one assumes moral costs would be incurred by savinglives. In this case, inaction in any (X,0) Trolley dilemma maximizes utility. In such a dilemma, to not take action would be consider an immoral act of omission. Proof of H3: Our last assumption concern the role of framing. Due to the distinction between personal and impersonal moral dilemmas (Greene et al, 2001) and based on the “contact principle” (Cushman et al, 2006), we predict an individual is more likely to take action in the INDIRECT frame. In our theoretical model, framing effect is captured by the fact that moral cost is higher of an action is higher in the DIRECT frame treatment, :;=&#x-5.3;琵? ;@:;=&#x-5.3;琵? . 3.2. Money Burning 39 Proof of H4: Under the assumption of either pure selfishness or utilitari

40 anism, individuals should never burn mon
anism, individuals should never burn money. Consider now the case of homo moralis agents represented by the following utility function: ,-.A !/1134/1/1134 (10) Here, the first term corresponds to initial material endowment that is independent of action ij; the second term is the total monetary cost for agent of burning other player’s payoff by choosing action ij. The third term is the moral cost of burning others’ resources. From (10) we derive the first order condition: .A 78\n8 (11)From (11) it is straightforward that whether the optimal action effort of money burning will be zero or positive depends on the sign of ’, which varies based on one being above or below one’s moral obligation action. If  is low (for instance if =0), which could be interpreted as the fact of having high moral obligation, then any increase of for  will increase the moral cost such that v’ � 0. In this case the non-monetary moral cost adds to the material cost c’ and reinforce the tendency not to burn. Only if  is sufficiently high such that   and v’ 0, there is a gain to increase effort and thus to engage in money burning Thus a relatively high  parameter may be interpreted as nastypreferences (Abbink and Sadrieh, 2008; Abbink and Herman, 2011). Specifically, individuals with nasty preferences (i.e. those having a sufficiently high moral target  such that any increase of effort a will reduce the nonmonetary cost (v’ 0), as long as  ) will engage in burning money if v’.66;鎐c’. Proof of H5: If disadvantageous inequality aversion matters, one should therefore observe money burning only when x y, while money should not be burnt in cases of advantageous inequality (i.e., x y). In our model, inequality aversion may be captured by a negative parameter z in the moral function of individuals with x y that may lead them to revise downward their ideal moral motivation. A negative z parameter reflects here the fact of being unfairly treated by Nature (i.e., given a low endowment). This negative z parameter then motivates money burning due to a revised moral obligation target. Proof of H6: Our theoretical framework allows us to account for pre-emptive retaliation by assuming that moral motivation is weak. Here weak moral motivation refers to one’s sensitivity to the expectation of others’ actions no

41 ted j a , which can lead to a revision
ted j a , which can lead to a revision of one’s moral ideal target. Thus in the bilateral treatment, individuals might revise upward their targeted level of money burning if they expect that the counterpart may burn, which may lead the individuals to engage in pre-emptive money burning to meet their ethical obligation. Proof of H7: This follows directly from the F.O.C. in (11), while holding v’ constant. 40 Proof of H8: This is a testable hypothesis based on our assumption that moral targets  in the Trolley dilemma reflect one’s ethics in other consequential decision problems. This is not mathematically proven. 41 Appendix CTable C1. Probability of burning money (model (1) reproduces model (3) in Table 6). Independent Variable (1) Marg. Effect (st. error) (2) Marg. Effect (st. error) Increasing (x,y) order (=1) -0.0196 (0.0510) -0.0220 (0.0513) Decreasing (x,y) order (=1) -0.0147 (0.0493) -0.0105 (0.0495) Unilateral Burn (=1) -0.0156 (0.0440) -0.0459 (0.0459) |Income other (x y)| 0.0005*** (.0002) 0.0005*** (.0002) Income .60;䝰 other (x .60;䝰 y) -0.0002 (0.0003) -0.0001 (0.0003) Income = other ( = 1) 0.0597 (0.0583) 0.0593 (0.0587) Relative cost -1.0741* (0.5787) -1.0903*  (0.5785) Action Propensity (Trolley dilemmas 2-10) 0.0675 (0.0546) 0.0551 (0.0463) Immoral Commission (=1) (action in Trolley 1&11) 0.2655*** (0.1154) 0.2064** (0.1152) Immoral Omission (=1) (inaction in Trolley 12) 0.3428*** (0.1282) 0.3055** (0.1699) Immoral Commission (=1) * Unilateral Burn 0.3864** (0.1868) Immoral Omission (=1) * Unilateral Burn 0.0913 (0.1697) Male (=1) -0.0157 (0.0433) -0.0007 (0.0435) Happiness  [1 ,10] (10=highest current life happiness) -0.0278* (0.0161) -0.0267 (0.0166) Religion  [1 ,10] (10=very important) 0.0053 (0.0078) 0.0062 (0.0080) Age -0.0135 (0.0133) -0.0166 (0.0139) Observations 1026 1026 # Participants^ 114^ 1114^ Log likelihood -406.183 -403.302 Notes: *.10, **.05, ***.001 for the 2-tailed test. Standard errors clustered at the individual subject level. Increasing, Decreasing, Random (reference group) control for the order of the money burning allocation scenarios. Relative Cost = the 10 experimental monetary units (EMU) cost divided by the payoff in EMU if choosing not to burn money. ^reduced as a result of those opting out of the Trolley dilemma choice, which is used