/
 A Hedonic Model of House Prices in the Greek Islands  A Hedonic Model of House Prices in the Greek Islands

A Hedonic Model of House Prices in the Greek Islands - PowerPoint Presentation

min-jolicoeur
min-jolicoeur . @min-jolicoeur
Follow
343 views
Uploaded On 2020-04-06

A Hedonic Model of House Prices in the Greek Islands - PPT Presentation

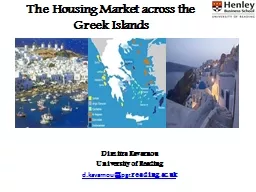
Dimitra Kavarnou University of Reading dkavarnou pgr readingacuk Supervised by Dr Anupam Nanda Prof Sotiris Tsolacos Idea This research examines the impact of local public amenities on house prices in the islands of Greece ID: 776263

islands port island time islands port island time significance log airport 001 property 002 distance 003 expensive results closer

Share:

Link:

Embed:

Download Presentation from below link

Download Presentation The PPT/PDF document " A Hedonic Model of House Prices in the ..." is the property of its rightful owner. Permission is granted to download and print the materials on this web site for personal, non-commercial use only, and to display it on your personal computer provided you do not modify the materials and that you retain all copyright notices contained in the materials. By downloading content from our website, you accept the terms of this agreement.


Presentation Transcript

Slide1

A Hedonic Model of House Prices in the Greek Islands

Dimitra KavarnouUniversity of Readingd.kavarnou@pgr.reading.ac.ukSupervised by: Dr. Anupam NandaProf. Sotiris Tsolacos

Slide2

Idea

This research examines the impact of local public amenities on house prices in the islands of Greece

By taking the Greek islands as the case study, we are trying to identify the significance and the influence on the house prices (assessed values) of several public amenities for 36 Greek Islands

The model also controls for several structural and locational characteristics of the properties as well as economic and demographic attributes of the islands

Slide3

It is an application of Hedonic Modeling on housing by controlling the public amenities (port, airport, hospital, university) and tries to identify the significance of their:presence time distances from the house propertiesOn the housing prices of the islands It has never been contacted before a research on the housing market of the Greek Islands It tries to explain variables and factors that the evaluators are influenced by in terms of amenities but they are not aware (not included into their criteria/list)

Why this Research - Aim

Slide4

Why this geographical area

The islands of Greece constitute a unique area on the planet as they are hundreds pieces of land in the sea

belonging

in the same nation (laws, policies,

tradition, culture, economy, etc.) but with lots of different characteristics

Isolated – difficult to approach areas

Very heterogeneous market – housing submarkets (tourism rates, employment

)

Why these 36 islands out of

hundreds

Criteria:

Permanent population 1,000 people/island (resent census 2011)

Minimum number of observations 15-20p. To each island

Excluded the 2 biggest islands of Greece (Crete and Evvoia – separate research)

Slide5

Where?

Greece

Slide6

Where?

Ionian Islands

Sporades Islands

Argo Saronic Islands

Cyclades Islands

North East Aegean Sea Islands

Dodecanese Islands

Slide7

1. Ionian Islands

Groups & Islands - I

Ionian Islands


Population (2011)

Geographical Size (km2)


1

Corfu

101,080

592


2

Ithaki

3,180

96


3

Kefallonia

35,590

781


4

Lefkada*

22,710

325


5

Zante

40,650

406


Total


203,210

2,200

Slide8

Groups & Islands - II

2. Sporades Islands

Sporades Islands


Population (2011)

Geographical Size (km2)


6

Alonnisos

2,800

64.5


7

Skiathos

6,110

48


8

Skopelos

4,830

95.5


9

Skyros

2,960

209.5

Total


16,700

417.5

Slide9

Groups & Islands - III

3. Argo Saronic Islands

Argo Saronic Islands


Population (2011)

Geographical Size (km2)


10

Salamina

39,220

95


11

Spetses

4,070

22


12

Ydra

1,980

50

Total


45,270

167

Slide10

Groups & Islands - IV

4. Cyclades Islands

Cyclades Islands  Population (2011)Geographical Size (km2) 13Andros9,170379.70 14Amorgos1,940121.46 15Kea2,420131.69 16Kythnos1,31096.90 17Milos4,960150.60 18Mykonos10,19086.13 19Naxos19,440429.00 20Paros13,710196.31 21Syros21,39084.07 22Thira/Santorini15,25076.91 23Tinos8,590194.59Total  108,3701,947.36

Slide11

Groups & Islands - V

5. North East Aegean Sea Islands

North East Aegean Sea islands


Population (2011)

Geographical Size (km2)


24

Chios

51,320

842


25

Ikaria

8,410

255


26

Lesvos

85,330

1,636


27

Limnos

17,000

476


28

Samos

32,760

476

Total


194,820

3,685

Slide12

Groups & Islands - VI

6. Dodecanese Islands

Dodecanese Islands


Population (2011)

Geographical Size (km2)


29

Astypalaia

1,310

96.90


30

Kalymnos

16,140

110.58


31

Karpathos

6,160

300.15


32

Kos

33,300

290.30


33

Leros

8,130

54.05


34

Patmos

3,040

34.14


35

Rhodes

115,290

1,400.68


36

Symi

2,580

57.87

Total


185,950

2,345

Slide13

Literature Review - I

Housing Market Attributes in General:

The heterogeneity of a housing market

(the

differentiation of the locations, the

islands, the amenities, the tourism rates,

the

employment,

etc

.)

T

he

external effects

in a housing market

(the several characteristics that are observed but not fully controlled or measured)

The immovability of the housing market

(that increases the demand for amenities)

T

he

durability of a market

(by examining the course of a housing market in the long run)

T

he

political

economy

(the

bundle of regulations, policies and

taxes)

T

he

imperfect information about a market

(that

lead to hidden

defects)

T

he transaction

costs

(that

lead to lagged market adjustments and to the intermediaries’

presence)

(

Kain

and Quigley, 1975;

Xu

, 2008)

Slide14

Literature Review - II

The Need for Public Amenities and their significances in every housing market

Globally

For difficult to approach areas (such as the islands) – the significance of fast commuting

Transportation (Ports/ Airports)

Hospital Social Care (Prefectural General Hospitals)

Higher Education (Universities)

(Schools are not in the scope of this research by making the assumptions that: a) all islands have public schools of all levels, b) private schools are not taken into consideration, c) no family would commute/ migrate from an island for better school provision)

(Wu et al.; 2013,

Wenjie

et al.; 2010, Davies and Robb;1998,

Royle

, 1995, Webster; 2001,

Prideaux

; 2000,

Carvalho

et al.; 2010

)

The Community Structure of the hundreds of islands

(trade, defence, architectural rules, etc.)

(

Dimitropoulos

; 2001)

Slide15

Methodology - I

Hedonic Regression Method (The method that decomposes the dependant variable under the scope into its constituent characteristics, and obtains assessments of the contributory value of each specific characteristic)(Rosen; 1974, Roback;1982, Bajari and Benkard; 2005) In this research, the dependant variable (Y) is the Assessed Housing Prices - AHP or P for every property (i) , island(j), group of island(k) Pi,j,k = α + ∑β Xi,j,k + εi,j,k In order to mitigate the problem of heteroskedasticity as well as to compare percentage-wise the effect on the Assessed Housing Prices(1) log(Pi,j,k)= α + ∑β Xi,j,k + εi,j,k

Υ

i

=

α + β

1

Χ

1

+ β

2

Χ

2

+

…+

β

i

X

i

+

ε

i

Slide16

Methodology - II

But

Τ

here are also

island characteristics

for each island (j):

(2)

log(P

i,j,k

) =

α + ∑β

X

i,j,k

+ ∑

γ

Z

j,k

+ ε

i,j,k

Controlling the

Fixed Effects

for each island:

(3)

log(P

i,j,k

) =

α + ∑β

X

i,j,k

+

δ

j

+ ε

i,j,k

(Boundary fixed effects model: Black;1999, Clapp, Nanda and Ross; 2008)

where

δ

is the total unobserved effects for each island (j) - dummies

Τ

here are also

group of

islands characteristics -

Controlling the

Fixed Effects

of each

group of islands (k):

(4)

log(P

i,j,k

) =

α + ∑β

X

i,j,k

+ ∑

γ

Z

j,k

+

Δ

k

+

ε

i,j,k

where

Δ

is the total unobserved effects for each group of islands (k) - dummies

Slide17

Data - I

Two files from the Bank of Greece including properties in the islands that have been evaluated from 2005-2013 with property characteristics:The property characteristics (Xi,j,k) included are:Some details about the property location (not exact)The living space (m2)The land area (m2)The date/year of permit, completion, evaluationThe property type (flat/detached house/ maisonette) and the floorSome information about the construction quality, the neighbourhood, the view (limited) Some information about the store rooms and the parking spaces

file 1

11,553

file 2

3,384

Total

14,937 pr.

Slide18

Data - II

Limitations of the dataset

Not exact location (address/number, to many cases only local toponyms of settlements)

Either because of incomplete dataset

But

Mainly because the properties in the Islands do

not

have an address themselves but they refer to the closest village/settlement

With this very limited information about their location, it was

VERY

difficult

and time-consuming to spot the properties and calculate their distances from the amenities (ports/airports)

Lots of missing/ incomplete values from the evaluators (view, land, year of completion/permit)

Slide19

Data - III

Data Set Cleaning:Out of the 14,937 properties I received, I excluded:3,620 properties in Evvoia and Crete (separate analysis – research) 850 approx. duplications 500 approx. did not concern properties on islands (incorrect entries)3,000 approx. to which the land area was not available 300 approx. to which the year of completion or the year of permit was not available (not able to calculate the age of the property) 300 approx. concerned islands with population<1,000p. or islands with insufficient number of observations/island (<15) 6,350 properties approx. in 36 islands to be spotted and calculated2,000 properties approx. not able to spot/ find the approx. location of the closer village in Google Earth/ Google maps 4, 369 properties spotted in the final dataset

Slide20

Data - IV

Spotting the properties in Google Earth (approximately)

Slide21

Data - V

Slide22

Data - VI

Calculating time distances in Google mapsto port: to airport:

Slide23

Data - VI

The

population

data come from the

Publication of provisional results of the 2011 Population

Census (Source: Hellenic Statistic Authority)

The following data – island characteristic variables

(Z

j,k

)

where collected by a travel agency (Express Holidays):

Sea Transportation:

The travel

duration

from each island to the

capital

(

slow

and

fast

boat – in minutes)

The

travel

duration

from

each island to the

closest

mainland

(

slow

and

fast

boat- in minutes)

The cost of travel

from each island to the

capital

(

slow

and

fast

boat – in

€)

The frequency of travel to

capital

(

slow

and

fast

boat,

summer

and

winter

– in travels/week)

Air Transportation

:

The

duration

of the flight from

each island to the

capital airport (Athens)

The

cost

of flight

from each island to the

capital airport

(average)

The

frequency

of

flights to

capital

(

summer

and

winter

– in travels/week)

Slide24

Data Analysis - I

Time Agenda

Data Cleaning1mSpotting properties in Google Earth6m       Calculating distances in Google Maps2m        Modelling - Data Analysis1m+…         …

Extracting all the useless entriesGoogle Earth due to lack of information of the property location I couldn’t use GIS as well asGoogle maps cause it is the only one calculating the time distances* I couldn’t use GISE-Views for every island separatelyStata for the big model of all islands …to be continued…

*For the islands it is meaningless to calculate the

km

distances since:

They are not comparable from island to island (different ground morphology, traffic, road conditions, etc.)

They are relatively small

After locating the properties, I created 2 new property characteristic variables (X

i,j,k

) which are the:

a)

Time distance to the port

b)

Time distance to the airport

Slide25

Data Analysis - II

Property Utilisation Ratio:Age:If the year of completion is available then:If the year of completion is not available then:**2 is the average duration of construction for housing properties in Greece (Source: BoG)Age ≥ 0 (the properties that were evaluated prior to their completion, i.e. age<0, their age is considered as 0)


Slide26

Data Analysis - III

Deflation of Assessed Housing PricesThe Prices are deflated and expressed in December 2012 prices:where:HICPDec2012= 123.28HICPt = the HICP of the month year of the evaluation(Source of the HICP tables: Hellenic Statistic Authority)Dummy Variables Xi,j,k for the property types:FlatDetached HouseMaisonette


Slide27

Data Analysis - IV

Dummy Variables (Z

j,k

) for controlling:

The Presence of Airport on the island

The Presence of Prefectural General Hospital on the island

The Presence of University on the

island

Dummy

Variables (

δ

j

)

for the fixed effects - controlling the unobserved heterogeneity of the islands

(one dummy for each island)

Dummy

Variables

(

Δ

k

)

for the fixed effects - controlling the unobserved heterogeneity of

the groups of

islands

(one dummy for each

group)

Slide28

RESULTS - I

IONIAN ISLANDS  Dependent Variable: LOG(REAL_ASSESSED_VALUES)  Variables (Xi,j,k) / ISLANDCORFUKEFALLONIAZANTELEFKADAITHAKIC8.264*** (41.53)8.859***(28.56)8.125***(22.28)7.859***(16.02)7.518***(11.68)LOG(LIVING_SPACE)0.793*** (15.94)0.652***(8.45)0.683***(9.56)0.754***(9.20)0.723***(4.25)LOG(LAND)0.090***(3.10)0.108***(3.43)0.137***(3.04)0.149**(2.41)0.274**(2.39)PUR-1.84E-05(-0.02)3.46E-05*(1.67)0.001(1.42)0.003**(2.01)0.005(1.60)FLOOR0.0001(0.03)0.046*(1.74)-0.003(-0.09)-0.053(-1.09)-0.014(-0.21)T2-0.184***(-4.19)-0.330***(-4.87)-0.122(-1.55)-0.022(-0.21)-0.587***(-4.55)T3-0.200**(-2.19)0.007(0.10)0.032(0.21)-0.061(-0.62)-AGE-0.003**(-2.55)-0.007***(-4.07)-0.003(-1.53)-0.010**(-2.49)-0.001(-0.28)TIME_DISTANCE_TO_PORT-0.015***(-3.93)-0.007**(-2.37)0.002(0.11)-0.002(-0.43)0.011(1.34)TIME_DISTANCE_TO_AIRPORT0.007*(1.75)0.000(0.09)-0.004(-0.31)--R20.700.580.510.750.58Adj. R20.690.560.490.730.54No of Observations3572362049385

Slide29

RESULTS - II

SPORADES ISLANDSDependent Variable: LOG(REAL_ASSESSED_VALUES)Variables (Xi,j,k) / ISLANDSKIATHOSALONNISOSSKOPELOSSKYROSC8.746***(7.34)9.718***(14.80)8.426***(15.06)9.527***(8.49)LOG(LIVING_SPACE)0.685***(3.10)0.567***(4.01)0.616***(5.87)0.617***(3.72)LOG(LAND)-0.007(-0.06)0.030(0.476)0.118*(1.94)0.035(0.37)PUR0.001(0.43)-0.003(0.002)0.001(0.53)-0.002(-0.76)FLOOR0.052(0.089)0.153(0.19)0.057(0.90)0.126(1.10)T2-0.347*(-1.89)-0.177(-1.54)0.142(1.349)-0.346**(-2.16)T3---0.618***(-4.08)0.019(0.09)AGE-0.008(-1.47)-9.04E-05(-0.02)-0.005**(-2.06)-0.006(-1.20)TIME_DISTANCE_TO_PORT-0.234*(-2.09)0.006(0.39)0.004(0.83)0.005(0.24)TIME_DISTANCE_TO_AIRPORT0.275**(2.25)---0.007(-0.29)R20.710.600.690.42Adj. R20.510.540.660.35No of Observations21 (n<30)498478

Slide30

RESULTS - III

ARGO SARONIC ISLANDSDependent Variable: LOG(REAL_ASSESSED_VALUES)Variables (Xi,j,k) / ISLANDYDRASPETSESSALAMINAC6.859***(4.28)8.477***(12.79)8.560***(26.64)LOG(LIVING_SPACE)-0.597(-0.70)0.741***(7.75)0.586***(5.49)LOG(LAND)1.469(1.63)0.153(1.50)0.213***(3.10)PUR0.015(1.23)0.001(0.26)0.002(1.35)FLOOR0.089(0.31)0.234*(1.87)0.052(1.42)T2-0.019(-0.065)-0.130(-1.24)-0.139**(-2.25)T3---0.312**(-2.46)AGE-0.009***(-3.16)-0.001(-0.58)-0.010***(-4.87)TIME_DISTANCE_TO_PORT0.026(0.37)-0.027(-0.42)-0.023***(-3.16)TIME_DISTANCE_TO_AIRPORT---R20.670.540.60Adj. R20.500.490.59No of Observations21 (n<30)83251

Slide31

RESULTS - IV

NORTH EAST AEGEAN ISLANDS  Dependent Variable: LOG(REAL_ASSESSED_VALUES)  Variables (Xi,j,k) / ISLANDLESVOSSAMOSLIMNOSCHIOSIKARIAC8.739***(22.61)8.260***(29.60)8.318***(19.93)8.332***(23.56)7.973***(6.72)LOG(LIVING_SPACE)0.662***(7.84)0.924***(12.46)0.694***(6.73)0.833***(8.49)0.427(1.27)LOG(LAND)0.119***(2.91)0.004(0.09)0.156**(2.51)0.024(0.31)0.198(1.48)PUR-0.000(-0.48)-0.003***(-2.72)-0.001(-0.40)-0.001(-0.49)0.011**(2.90)FLOOR-0.006(-0.26)0.010(0.52)-0.045(-1.48)-0.034*(-1.74)0.037(0.47)T2-0.304***(-4.88)-0.224***(-3.57)-0.184**(-2.26)-0.073(-1.43)0.363(0.90)T30.178**(2.51)0.126(0.97)-0.446***(5.86)-AGE-0.006***(-4.97)-0.007***(-4.94)-0.006***(-3.31)-0.007***(-5.41)0.004(0.70)TIME_DISTANCE_TO_PORT0.003(0.28)-0.003(-0.99)-0.005(-1.59)-0.005**(-1.99)-0.010(-0.55)TIME_DISTANCE_TO_AIRPORT-0.005(-0.46)-0.003(-1.32)5.60E-05(0.01)-0.001(-0.22)0.001(0.33)R20.560.730.710.680.77Adj. R20.550.720.680.670.60No of Observations3472137026420 (n<30)

Slide32

RESULTS - V

CYCLADES ISLANDS        Dependent Variable: LOG(REAL_ASSESSED_VALUES)        Variables (Xi,j,k) / ISLANDNAXOSSYROSTINOSTHIRAPAROSMILOSKEAKYTHNOSMYKONOSAMORGOSANDROSC8.38***(19.60)7.815***(20.26)8.72***(12.03)8.894***(12.12)7.622***(11.07)9.329***(16.40)8.730***(14.83)11.276***(10.50)9.038***(17.96)8.732***(17.02)9.742***(24.26)LOG(LIVING_SPACE)0.918***(8.02)0.720***(6.52)0.597***(4.93)0.658***(2.75)1.026***(8.65)0.529***(5.69)0.938***(7.25)0.009(0.04)0.828***(11.17)0.710***(5.90)0.643***(5.69)LOG(LAND)0.178(0.26)0.221***(2.97)0.156*(1.94)0.088(0.54)-0.200(-0.22)0.169**(2.02)-0.079(-0.97)0.18(1.69)0.042(0.80)0.059(0.89)0.029(0.62)PUR-0.002(-1.15)0.002(1.27)0.004(1.31)0.002(0.42)-0.003(-1.03)0.002(0.91)-0.003(-0.90)0.004(1.43)0.001(0.60)-0.003(-1.41)-0.001(-0.92)FLOOR0.059(1.33)-0.019(-1.16)-0.029(-0.88)0.012(0.16)0.049(0.53)0.033(1.10)0.053(0.60)-0.33**(-2.65)0.104(1.09)0.054(0.56)0.079**(2.12)T2-0.402***(-4.00)-0.192**(-2.34)-0.093(-0.82)-0.027(-0.24)-0.237**(-2.09)-0.002(-0.02)0.224(1.33)-0.162(-1.00)0.017(0.15)0.101(0.87)-0.42***(-5.54)T30.009(0.05)0.304**(1.99)-0.487***(-3.09)0.001(0.01)0.492(2.21)0.401***(3.20)0.136(0.59)-0.287(1.36)--0.654***(-7.91)AGE-0.008***(-3.93)-0.003(-1.50)-0.015***(-4.42)-0.010**(-2.41)-0.003(-1.06)-0.005**(-2.08)-0.007***(-3.13)-0.008**(-2.31)-0.008***(-4.02)-0.001(-0.65)-0.008***(-4.03)TIME_DISTANCE_TO_PORT0.024(1.39)-0.0004(-0.05)-0.004(-0.77)0.001(0.08)0.029***(2.83)0.048**(2.30)-0.002(-0.52)-0.016(-1.16)0.001(0.04)-0.004(-0.55)-0.0002(-0.11)TIME_DISTANCE_TO_AIRPORT-0.019(-1.27)-0.007(-0.64)-0.001(0.08)-0.003(-0.45)-0.705***(-3.50)---0.010(-0.76)--R20.650.680.700.580.770.660.690.770.700.680.51Adj. R20.610.660.670.510.730.620.660.540.690.600.48No of Observations79132786867778515 (n<30)15837166

Slide33

RESULTS - VI

DODECANESE ISLANDS     Dependent Variable: LOG(REAL_ASSESSED_VALUES)     Variables (Xi,j,k) / ISLANDRHODESPATMOSKOSKALYMNOSSYMIASTYPALAIAKARPATHOSLEROSC8.282***(26.92)8.050***(21.27)6.702***(24.18)7.671***(17.08)9.249***(8.04)9.253***(6.39)8.008***(36.71)7.927***(16.72)LOG(LIVING_SPACE)0.729***9.36)0.639***(7.10)0.915***(12.41)0.842***(7.427)1.056**(2.57)0.591*(2.01)0.939***(8.51)0.734***(13.06)LOG(LAND)0.121***(2.60)0.218***(4.00)0.167***(3.82)0.069(1.12)-0.281(0.63)0.149(0.67)-0.021(-0.34)0.181***(3.52)PUR0.001(1.18)0.004**(2.58)0.001(1.11)-0.0002(-0.15)0.001(-0.20)-0.001(-0.34)-0.0004(-0.47)0.002(1.65)FLOOR-0.008(-0.31)-0.077(-1.31)0.021(0.77)-0.008(-0.47)-0.140(-0.54)0.379(1.04)-0.031(-0.94)-0.082*(-1.80)T2-0.037(-0.73)-0.241***(-2.72)-0.145(-1.58)-0.081(-0.84)-0.084(-0.50)0.078(0.29)-0.038(-0.29)-0.10(-1.45)T30.031(0.36)-0.845***(8.52)-0.869**(-2.47)-0.021(-0.11)---AGE-0.008***(-5.73)-0.002(-1.21)-0.006***(-3.72)-0.004**(-2.34)-0.003(-0.83)-0.002(-0.37)-0.013***(-3.14)-0.002(-0.90)TIME_DISTANCE_TO_PORT-0.008***(-4.48)0.008(0.80)0.002(0.73)-0.009(-1.18)-0.004(-0.34)-0.054(-1.26)0.006(1.25)-0.019(-1.43)TIME_DISTANCE_TO_AIRPORT0.005***(3.28)-0.008**(2.36)0.017**(2.02)--0.038(-1.23)--0.013(-0.89)R20.650.720.820.680.600.800.910.83Adj. R20.640.690.800.650.470.710.870.81No of Observations503831571043425 (n<30)26 (n<30)56

Slide34

RESULTS - VII

For all islands the living space is positively very significant to the prices (1% significance level) 1% increase in living space 0.52-1.06% increase to the prices ( 0.74% increase - weighted average)For some of the islands the land space is positively significant (1% or 5%)(For 16/36 islands including all Ionian Islands, Skopelos-Sporades, Salamina-Argo Saronic, Lesvos and Limnos-NE Aegean, Syros, Tinos and Milos-Cyclades, Rhodes, Patmos, Kos and Leros-Dodecanese Islands)1% increase in the land area 0.09-0.27% increase to the prices (0.15% increase - weighted average)The Property Utilisation Ratio is relatively not significant for most of the islands (gardens/yards not significant)The floor number is relatively not significant for most of the islands

Slide35

RESULTS - VIII

The

property type (flats/detached houses/

maisonettes

)

seems to be very significant for most of the islands

D

etached houses

to 14/36 islands

negatively

very significant (1-5%)

compared

to

flats

i.e.

The flats are

more

expensive

compared to detached houses – probably because flats are located to the islands’ capitals the

proximity to the capital

is very important for these islands

Mainsonettes

to 7/23 islands

negatively

very significant (1-5%)

compared to flats

i.e.

The flats are

more expensive

compared to

maisonettes

– probably because they are located to the islands’ capitals and

the proximity to the capital

is very important for these 7 islands

Mainsonettes

to 5/23 islands

positively

very significant (1-5%)

compared to flats

i.e.

The flats are

less expensive

compared to

maisonettes

– probably because of their construction/ property characteristics/ extra facilities/ landscape

Slide36

RESULTS - IX

The Age is negatively very significant (1-5%) for most of the islands (22/36) Every Additional Year 0.3-1.5% decrease of house prices (0.69% decrease - weighted average)Regarding the time distance of the properties to the ports/ airports:Time Distance to Port:For the biggest islands (big distances) the time distance to the port is negatively very significant (1-5%) - the closer to the port, the more expensive - apart from specific cases (eg. Lesvos)For the smallest islands (not very big in size) or the islands that are relatively close to the capital the time distance to the port was not very significant - apart from specific cases (eg. Paros – Milos - Salamina)Time Distance to Airport:For some of the islands the time distance to the airport is positively very significant (1-10%) – the closer to the airport the less expensive - apart from specific cases (eg. Milos) - Probably because of the noise and disturbance.

Slide37

RESULTS - X

Ionian IslandsCorfuNegative Significance to the port*** (1%) i.e. the closer the property to the port, themore expensive.Positive Significance to the airport*(10%)i.e. the closer the property to the airport, theless expensive. KefalloniaNegative Significance to the port** (5%) i.e. the closer the property to the port, themore expensive – 3 main portsNo Significance to the airportLefkadaNo Significance – Road Connected IslandZanteNo Significance – Villages are gathered toThe South East part – no big distancesIthakiNo Significance to the port – Small island

Slide38

RESULTS - XI

Dodecanese IslandsRhodesNegative Significance to the port*** (1%) i.e. the closer the property to the port, themore expensive.Positive Significance to the airport***(1%)i.e. the closer the property to the airport, theless expensive Kos & KalymnosPositive Significance to the airport**(5%)i.e. the closer the property to the airport, theless expensive – Medium Sizes islands (population &geographical size) with very busy airports (6th and 9th airports of the country) Patmos/ Symi/ Astypalaia/ Karpathos/ LerosNo SignificanceSmaller Islands/ Smaller distances

Slide39

RESULTS - XII

Argo Saronic IslandsSalaminaNegative Significance to the port*** (1%) i.e. the closer the property to the port, themore expensive.It is the island closer to Athens (only 15minsby boat) – people live in the island and commute to Athens to work, so very big influence to the house prices because of the Port.Spetses/ YdraNo SignificanceSmall Islands/ small distancesIn these 2 islands cars are not allowed (distances are calculated by car for comparison purposes) – motorbikes are allowed

Slide40

RESULTS - XII

Sporades IslandsSkiathos Negative Significance to the port* (10%) i.e. the closer the property to the port, themore expensive.Positive Significance to the airport**(5%)i.e. the closer the property to the airport, theless expensive – Small sample Skopelos & AlonnisosNo Significance to port - Small Islands – Small DistancesSkyrosNo Significance to port/airportSmall island/distances

Slide41

RESULTS - XIII

North East Aegean Sea IslandsChiosNegative Significance to the port** (5%) i.e. the closer the property to the port, the more Expensive - No Significance to the airportLesvosNO Significance (???)Compared with Corfu & Rhodes (similar size, population, distance from capital-mainland) Rhodes has the 3rd bigger airport of Greece and Corfu the 5th while Lesvos’s airport is not in the top 10 list. So, people prefer to travel to Lesvosby boat. Corfu is 45’ by boat from the mainland While Lesvos is 13h!!! So, port is not significant either.SamosNo Significance – 2 main ports Limnos & IkariaNo Significance

Slide42

RESULTS - XIV

Cyclades Islands- Are ALL relatively close to a main port of AthensNot very big islands (in terms of time distances on the islands) NO Significances Expected to the portsBUTParosPositive Significance to the port***(1%)i.e. the closer the property to the port, the less expensive!!! probably because the port is located in a town called “Paroikia” while there is another much more expensive and cosmopolitan town called “Naousa” which is far away from the port MilosPositive Significance to the port**(5%)i.e. the closer the property to the port, the less expensive! – the capital is not close to the PortNegative Significance to the airport*** (1%) i.e. the closer the property to the airport, the more expensive – the most beautiful beaches and landscapes are at the South side of the island close to the airportSyros/Tinos/Thira/Kea/ Kythnos/ Amorgos/ AndrosNo Significance

Slide43

RESULTS – XV – Big Model

Variables/ Models

OLS (1a)OLS (1b)With airportOLS (2)Fixed Effects j (3)Fixed Effects (4a)Fixed Effects (4b)C8.165***(115.74)8.093***(97.97)8.270***(100.19)8.176***(106.91)8.236***(117.34)8.092***(96.68)Log(living_space)0.773***(44.51)0.764***(37.85)0.777***(39.62)0.793***(42.56)0.776***(46.47)0.784***(40.73)Log(land)0.124***(10.93)0.141***(10.54)0.131***(10.00)0.101***(8.02)0.116***(10.45)0.123***(9.62)Pur0.000(0.06)0.0003(1.01)0.000(0.72)-0.000(-0.21)0.000(0.73)0.000(0.29)Floor-0.015**(-2.17)-0.136*(-1.82)-0.000(-0.04)0.001(0.16)-0.001(-0.17)-0.003(-0.39)T2-0.173***(-10.38)-0.187***(-9.59)-0.210***(-10.94)-0.204***(-11.19)-0.207***(-12.74)-0.205***(-10.95)T30.065(1.42)0.865*(1.72)0.088*(1.80)0.830*(1.80)0.043(0.98)0.081*(1.70)Age-0.002***(-8.52)-0.002***(-7.27)-0.003***(-7.86)-0.003***(-8.70)-0.002***(-8.74)-0.002***(*7.62)Time_distance_to_port-0.0047***(-9.31)-0.001(-0.87)-0.002***(-2.88)-0.004***(-4.25)-0.004***(-7.43)-0.004***(-4.38)Time_distance_to_airport--0.005***(-6.12)-0.002***(-2.64)-0.001(-0.97)--0.001(-0.78)Presence of Airport----0.014(0.57)-Presence of Hospital---362***(-11.95)--0.271***(-7.81)-0.189***(-4.85)Presence of University---0.037(-1.26)-0.048(1.27)-0.043(-1.09)Population--0.002***(5.34)--0.000(-0.63)0.002***(3.38)Geographical Size---6.54E-06(-0.23)-0.0001***(4.35)0.0001***(2.92)R20.5630.5890.6130.6590.6050.630Adj. R20.5620.5860.6110.6560.6030.628Observations4,3573,1683,1683,1684,3573,168

log(Pi,j,k)= α + ∑β Xi,j,k + εi,j,k

log(Pi,j,k) = α + ∑β Xi,j,k + ∑γZj,k + εi,j,k

log(P

i,j,k

) = α + ∑β Xi,j,k + δj + εi,j,k

log(P

i,j,k) = α + ∑β Xi,j,k + ∑γZj,k + Δk + εi,j,k

Slide44

What’s next?

Improve the Big Model with all the islands included by trying many combinations of island characteristics (

Z

i,j,k

) as well as the Fixed Effects

Specify Splines in the Age and Living Space

and

the time distance

to port/airport

Variables

Interpret the exact effect of every variable on prices

Group the results in different groups and combinations of islands

Slide45

Any Questions?

Comments

please

T

hank you