PPT-Binary Decision Diagrams Part 2
Author : min-jolicoeur | Published Date : 2019-03-19
15414 Bug Catching Automated Program Verification and Testing Sagar Chaki September 14 2011 BDDs Recap Typically mean Reduced Ordered Binary Decision Diagrams ROBDDs
Presentation Embed Code
Download Presentation
Download Presentation The PPT/PDF document "Binary Decision Diagrams Part 2" is the property of its rightful owner. Permission is granted to download and print the materials on this website for personal, non-commercial use only, and to display it on your personal computer provided you do not modify the materials and that you retain all copyright notices contained in the materials. By downloading content from our website, you accept the terms of this agreement.
Binary Decision Diagrams Part 2: Transcript
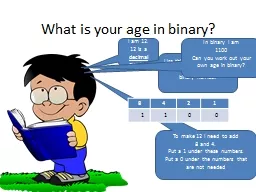
15414 Bug Catching Automated Program Verification and Testing Sagar Chaki September 14 2011 BDDs Recap Typically mean Reduced Ordered Binary Decision Diagrams ROBDDs Can be viewed as reduced forms of Ordered Binary Decision Trees. This number representation uses 4 bits to store each digit from 0 to 9 For example 1999 10 0001 1001 1001 1001 in BCD BCD wastes storage space since 4 bits are used to store 10 combinations rather than the maximum possible 16 BCD is often used in b State Diagrams -- 2State diagrams model processes (business processes,achine processes, or anything -between.)vents, conditions and actions (all optional)Event[Condition]/ActionInitial and final state Relationship to Acyclic Automata and . Complexities of Binary Set Operations. Shuhei Denzumi. 1. , Ryo Yoshinaka. 2, 1. , . Shin-ichi Minato. 1,2. , and . Hiroki Arimura. 1. 1) Hokkaido University. 2) JST ERATO Minato Discrete Structure Manipulation System Project. Eileen Kraemer. CSE 335. Michigan State University. Types of Diagrams. Structural Diagrams – focus on static aspects of the software system. Class, Object, Component, Deployment. Behavioral Diagrams – focus on dynamic aspects of the software system. Thinking Creatively. Ishikawa Diagrams (or Herringbone Diagrams). Machines. Methods. Manpower. Materials. Measurements. Milieu. Primary. Cause. Secondary. Cause. Thinking Creatively. Ishikawa Diagrams (or Herringbone Diagrams). GLY 4200 . Fall, 2016. 2. Binary Diagrams. Binary diagrams have two components. We therefore usually choose to plot both T (temperature) and X (composition) with pressure held constant. P-X (T fixed) or P-T (X fixed) are also possible. I am 12.. 12 is a . decimal . number. Use this table to convert a decimal number into a binary number.. To make 12 I need to add. 8. and 4.. Put a 1 under these numbers.. Put a 0 under the numbers that are not needed. Variables to Develop . A. lgebra Skills. Core Mathematics . Partnership. Building Mathematical Knowledge . and. High-Leverage Instruction for Student . Success. Thursday, September 11, 2014. 4:30 – 7:30 . MARYAM ALDOSSRAAY. 200700562. DEMAH AL-SHAMMASI. 200800222. Out Line . History of sketching . How to draw bubble diagram. Artist . History of . Sketching . Sketching: . is . a rapidly executed freehand . GLY 4200 . Fall, . 2017. 2. Unary Diagrams. Unary diagrams . have a single component. We therefore usually choose to plot both P (pressure) and T (temperature) since composition is not a variable. Examples. Decimal. . vs. Binary. = 1001. = 101. = 10. 1 = on =. 0 = off = . On and off. Creating a decimal number from a binary number. STAGE 1. The decimal number is ________. Creating decimal from binary. What is binary?. You and I write numbers like this: twelve is 12, sixty eight is 68, and one hundred is 100. Binary is a . number system . that computers use. That is, binary is the way that computers express numbers.. Fall, 2017. 2. Binary Diagrams. Binary diagrams have two components. We therefore usually choose to plot both T (temperature) and X (composition) with pressure held constant. P-X (T fixed) or P-T (X fixed) are also possible. Look at the . untis. of measurement for computer data. Bit. Byte. Nibble. Kilobyte. Mega / . giga. / . tera. byte. Binary. Nibble. Computers work in binary. We found out why in the hardware section (lesson 5)..
Download Document
Here is the link to download the presentation.
"Binary Decision Diagrams Part 2"The content belongs to its owner. You may download and print it for personal use, without modification, and keep all copyright notices. By downloading, you agree to these terms.
Related Documents