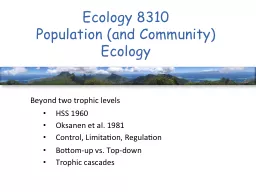
Beyond two trophic levels HSS 1960 Oksanen et al 1981 Control Limitation Regulation Bottomup vs Topdown Trophic cascades Beyond two trophic levels Why is the world green Observation Plants are abundant thus ID: 642209
Download Presentation The PPT/PDF document "Ecology 8310 Population (and Community) ..." is the property of its rightful owner. Permission is granted to download and print the materials on this web site for personal, non-commercial use only, and to display it on your personal computer provided you do not modify the materials and that you retain all copyright notices contained in the materials. By downloading content from our website, you accept the terms of this agreement.
Slide1
Ecology 8310Population (and Community) Ecology
Beyond two trophic levels
HSS 1960
Oksanen
et al. 1981
Control, Limitation, Regulation
Bottom-up vs. Top-down
Trophic cascadesSlide2
Beyond two trophic levels…Slide3Slide4
Why is the world green?Observation: Plants are abundant; thus…
Plants are NOT herbivore-limited: they are resource-limitedHerbivores are NOT limited by their food: they are limited by their predatorsTherefore, Predators must be limited by
their
resources
Source of limitation alternates among trophic levels
Vs.Slide5
Number of citations
Lots of controversy initially
Not much…
1981?Slide6Slide7
Extended basic predator-prey model (LV, Rosenzweig…)
Note: Planar carnivore isocline (why?)Curved plant isocline (why?)Curved herbivore isocline (why?)
INCREASE PRODUCTIVITYSlide8Slide9
It's complicated…an oversimplified cartoon:Slide10
Potential Productivity
Abundance (or biomass)
1TL 2TL 3TL 4TL
2
o
Carnivores
1
o
Carnivores
Herbivores
Plants
See
Mittelbach
et al. 1988;
Leibold
1989Slide11
Link to empirical patterns (recall lake data)……what about terrestrial systems?Slide12Slide13Slide14
Recall Sarnelle's meta-analysis (
zoop effects more pronounced at higher nutrients), as predicted by Oksanen et al…Chase et al. summarized herbivore exclusion experiments in grasslands and found…Slide15
Herbivores remove 50%
Vs. noneSlide16
Why?Slide17
These patterns are focused on herbivore-plants…let's add one more level:Slide18
Prey
PredatorsResource
Prediction:
Trophic
cascade
+
+
_
_
+Slide19
How do herbivores and plants respond to predator manipulations?Slide20
Why are the observed data <1:1?Slide21
Do trophic cascades support HSS/Oksanen?Slide22
Discussion:
Persson et al. (1988) [and many others…]
…predator and prey are regulated by different factors. Top carnivores are predicted to be resource-limited, while plants … should be controlled by grazers…
What do we mean by "limited", "controlled" and "regulated"?Slide23Slide24Slide25Slide26Slide27
Resource
Limitation
Predator Limitation
0.025
(0.012-0.038)
0.0011
(0.001-0.0031)
0.042
(0.032-0.052)
0.0056
(0.0035-0.0077)
0.098
(0.088-0.107)
0.031
(0.001-0.052)Slide28
Herb x
Fert experimentsSlide29Slide30
So, producers (and higher trophic levels) are limited by both resources and
predatorsRelative importance, effects of productivity and trophic cascades likely reflects heterogeneity within trophic levels