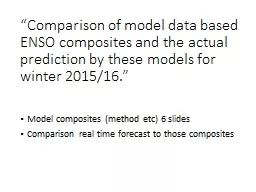
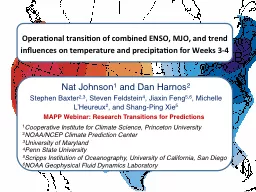
/
Operational transition of combined ENSO, MJO, and trend inf Operational transition of combined ENSO, MJO, and trend inf

Operational transition of combined ENSO, MJO, and trend inf - PowerPoint Presentation

min-jolicoeur
min-jolicoeur . @min-jolicoeur
Follow
399 views
Uploaded On 2017-03-31

Operational transition of combined ENSO, MJO, and trend inf - PPT Presentation

Nat Johnson 1 and Dan Harnos 2 Stephen Baxter 23 Steven Feldstein 4 Jiaxin Feng 56 Michelle LHeureux 2 and ShangPing Xie 5 1 Cooperative Institute for Climate Science Princeton University ID: 532116

mjo forecast tool enso forecast mjo enso tool precipitation amp weeks week skill guidance forecasts climate pattern temperature trend

Share:

Link:

Embed:

Download Presentation from below link

Download Presentation The PPT/PDF document "Operational transition of combined ENSO,..." is the property of its rightful owner. Permission is granted to download and print the materials on this web site for personal, non-commercial use only, and to display it on your personal computer provided you do not modify the materials and that you retain all copyright notices contained in the materials. By downloading content from our website, you accept the terms of this agreement.


Presentation Transcript

Slide1

Operational transition of combined ENSO, MJO, and trend influences on temperature and precipitation for Weeks 3-4

Nat Johnson

1

and Dan

Harnos

2Stephen Baxter2,3, Steven Feldstein4, Jiaxin Feng5,6, Michelle L’Heureux2, and Shang-Ping Xie5

1Cooperative Institute for Climate Science, Princeton University2NOAA/NCEP Climate Prediction Center3University of Maryland4Penn State University5Scripps Institution of Oceanography, University of California, San Diego6NOAA Geophysical Fluid Dynamics Laboratory

MAPP Webinar: Research Transitions for PredictionsSlide2

NOAA CPC is bridging the forecast gap in weeks 3-4

Key Questions:

What are the sources of skill for lead times of 3-4 weeks?

How do we translate that knowledge into operational forecast guidance?

http://www.cpc.ncep.noaa.gov/products/predictions/WK34/Slide3

Many studies indicate that the tropics are a key source of extended-range midlatitude predictability.

Specifically, relationships with the El Niño/Southern Oscillation (ENSO

) and Madden-Julian Oscillation (MJO) hold promise for weeks 3-4.

Riddle, Stoner, Johnson,

L’Heureux

, Collins, and Feldstein (2013, Climate Dynamics)500-hPa height anomalies (m)Temperature anomalies (ᵒC)Days that MJO precedes patternAnomalous frequency of cluster pattern (top left) occurrence (%) MJO influence on cluster pattern

The MJO gives information on pattern occurrence 10-25 days in advanceMJO phase

A weekly cluster patternSlide4

How do we transition the gains from our research into an operational forecast tool?We generate winter North American temperature forecasts for weeks 3-4 based on empirical relationships with MJO, ENSO, and the linear trend (Johnson et al. 2014,

Weather and Forecasting)

Climatology

MJO+ENSO+trend

forecast

Simple but transparentTranslates research into practical guidance for the forecasterProduces skillful forecasts Slide5

For some initial states of the MJO and ENSO, the skill scores of the weeks 3-4 T2m forecasts from the empirical model are substantially higher than the typical skill scores of dynamical models.Slide6

Operational AdaptationExtend periods from DJFM to 12 running 3-month periods.

Shift from ERA-Interim to daily observations:CPC 2-m Temperature (Janowiak, et al. 1999)CPC Unified Gauge-Based Analysis (Xie, et al. 2010)

Fourth root taken to increase distribution normality.Shift from three-class to two-class forecast.Combined product for Weeks 3 and 4.Slide7

Weeks 3+4

Heidke Skill Score from combined effects of ENSO+MJO+TrendSlide8

Embedded periods of lower/higher skill dependent upon background climate state.

Note even with a weak MJO, skill is present. Active background state not necessary for a skillful forecast (due to trend and nonlinearity of ENSO).Slide9

Temperature

Top left: Forecast (from 6/19)

Mid/Bot left: Forecast tool output

Bot right: Observations (7/4-17)

Coherence between statistical tool and forecast, despite tool being unavailable to forecasters.

Forecast and tool verified well.Slide10

Precipitation

Top left: Forecast (from 6/19)

Mid/Bot left: Forecast tool output

Bot right: Observations (7/4-17)

Less agreement between tool and forecast made without it.

Forecast and tool performance comparable.Slide11

Week 3-4 Forecast Guidance

Dynamical: CFSv2, ECMWF, JMA

Geopotential heights

T2m & Precipitation anomalies

T2m & Precipitation probabilities

Statistical models:ENSO/MJO phase modelConstructed analogCoupled linear-inverse modelObservations:ENSO & MJOSea IceSoil MoistureTropical CyclonesSlide12

Week 3-4 Forecast Guidance

Dynamical: CFSv2, ECMWF, JMA

Geopotential heights

T2m & Precipitation anomalies

T2m & Precipitation probabilities

Statistical:ENSO/MJO phase modelConstructed analogCoupled linear-inverse modelObservations:ENSO & MJOSea IceSoil MoistureTropical CyclonesSlide13

Week 3-4 Forecast Guidance

Dynamical: CFSv2, ECMWF, JMA

Geopotential heights

T2m & Precipitation anomalies

T2m & Precipitation probabilities

Statistical:ENSO/MJO phase modelConstructed analogCoupled linear-inverse modelObservations:ENSO & MJOSea iceSoil moistureTropical cyclonesSlide14
Slide15

Conclusions

A simple empirical model for probabilistic T2m

and precipitation forecasts

based on the initial state of the MJO and ENSO

produces skillful Week 3-4 forecasts over

North America across various seasons and climate states.This empirical model has been undergone successful R2O prior to CPC’s experimental Week 3-4 forecast product going live, and has become a key component of the forecasting process.Research team member participation in the Week 3-4 forecasting process has aided statistical tool interpretation by forecasters, and led to feedback for subsequent product development in an O2R sense.