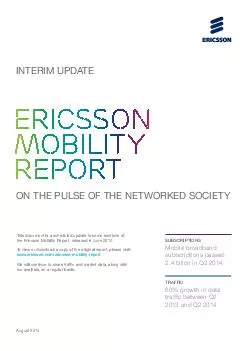
/
This document is a scheduled update to some sections of the Ericsson Mobility Report released This document is a scheduled update to some sections of the Ericsson Mobility Report released

This document is a scheduled update to some sections of the Ericsson Mobility Report released - PDF document

min-jolicoeur
min-jolicoeur . @min-jolicoeur
Follow
493 views
Uploaded On 2014-10-20

This document is a scheduled update to some sections of the Ericsson Mobility Report released - PPT Presentation

To view or download a copy of the original report please visit wwwericssoncomericssonmobilityreport We will continue to share traf64257c and market data along with our analysis on a regular basis ERICSSON MOBILITY REPORT ON THE PULSE OF THE NETWORKE ID: 6739

view download

Share:

Link:

Embed:

Download Presentation from below link

Download Pdf The PPT/PDF document "This document is a scheduled update to s..." is the property of its rightful owner. Permission is granted to download and print the materials on this web site for personal, non-commercial use only, and to display it on your personal computer provided you do not modify the materials and that you retain all copyright notices contained in the materials. By downloading content from our website, you accept the terms of this agreement.


Presentation Transcript

This document is a scheduled update to some sections of the Ericsson Mobility Report, released in June 2014.To view or download a copy of the original report, please visit: www.ericsson.com/ericsson-mobility-reportWe will continue to share trafc and market data, along with our analysis, on a regular basis. ERICSSONMOBILITYREPORTON THE PULSE OF THE NETWORKED SOCIETY Mobile broadband subscriptions passed 2.4 billon in Q2 2014 TRAFFIC 60% growth in data trafc between Q2 2013 and Q2 2014 August 2014INTERIM UPDATE 6.8 billionmobile subscriptions globally in Q2 2014530Western Europe590Central and Eastern Europe370Middle East850Africa1,360APAC (excluding China and India)800India720Latin America1,260China370North AmericaMobile subscriptions ERICSSON MOBILITY REPORT ATE AUGUST 2014Total mobile subscriptions up to and including Q2 2014 were around 6.8 billion. Of these, 80 million new subscriptions were added during Q2 2014. However, the actual number of subscribers is around 4.6 billion, since many have several subscriptions.Global mobile penetration was 94 percent in Q2 2014. Other interesting developments include: hina grew most in the quarter in terms of netadditions (+12 million), followed by Russia (+5 million),India (+5 million) and Indonesia (+4 million). obile subscriptions are growing around 6 percent year-on-year and 1.1 percent quarter-on quarter. n Q2 2014, mobile broadband subscriptions passed2.4 billion, growing by around 140 million, reectinga year-on-year increase of around 35 percent. CDMA and HSPA subscriptions grew by around 70 million and LTE subscriptions increased by approximately 40 million to 280 million. The total number of subscriptions capable of using GSM grew by 90 million, while GSM-only subscriptions declined by 40 million, a rate of 1 percent. round 300 million smartphones were sold in Q2 2014. This device represented more than 65 percent of all mobile phones sold in Q2 2014, compared to around 55 percent in Q2 2013. Of all mobile phone subscriptions, around 35 percent are associated with smartphones, leaving considerable room for further uptake.Indian subscriptions include active VLR subscriptions. Mobile subscriptions (million) ri127%INTERIM UPDATE AUGUST 2014 ERICSSON MOBILITY REPORT Note that Turkey has been included as part of the Middle East instead of Central and Eastern Europe since Ericsson Mobility Report November 2013. 103%North AmericaWestern Europe144%Central and Eastern Europe108%Middle East75%Africa105%APAC (excluding China and India)63%India116%Latin AmericaChinaPenetration Global penetration94%90% millionmillionmillionmillionmillionmillionmillionmillionmillionNorth AmericaWestern Europe 80 millionnew mobile subscriptions globally in Q2 2014ti Mobile Trafc Global trafc in mobile networks The graph below shows total global monthly data and voice trafc. It depicts a strong increase in data trafc with a moderating rate of growth and at voice trafc development. The number of mobile data subscriptions is increasing rapidly, and driving growth in data trafc along with a continuous increase in the average data volume per subscription. Data trafc grew around 10 percent between Q1 2014 and Q2 2014.It should be noted that there are large differences in trafc levels between markets, regions and operators.These measurements have been collected by Ericsson over several years using a large base of commercial networks that together cover all regions of the world. They form a representative base for calculating total trafc in the world’s mobile networks.The contents of this document are based on a number of theoretical dependencies and assumptions and Ericsson shall not be bound by or liable for any statement, representation, undertaking or omission made in this document. Furthermore Ericsson may at any time change the contents of this document at its sole discretion and shall not be liable for the consequences of such changes.Ericsson ABSE-126 25 Stockholm, SwedenTelephone +46 8 19 0000www.ericsson.comEAB-14:045541 Uen, Revision A© Ericsson AB 2014 Trafc does not include DVB-H, Wi-Fi, or Mobile WiMax. Voice does not include VoIP. 1,5001,0002,0002,500500 VoiceDataTotal (uplink + downlink) monthly trafc (PetaBytes)2014Q1 2010Q2Q3Q42011Q2Q3Q42012Q2Q3Q42013Q2Q3Q4 60%growth in data trafc between Q2 2013 and Q2 2014