/
Aggregate Supply, Aggregate Demand, and Inflation: Putting It All Together Aggregate Supply, Aggregate Demand, and Inflation: Putting It All Together

Aggregate Supply, Aggregate Demand, and Inflation: Putting It All Together - PowerPoint Presentation

mitsue-stanley
mitsue-stanley . @mitsue-stanley
Follow
346 views
Uploaded On 2019-06-29

Aggregate Supply, Aggregate Demand, and Inflation: Putting It All Together - PPT Presentation

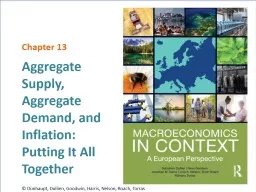
Chapter 13 Dünhaupt Dullien Goodwin Harris Nelson Roach Torras Learning goals After todays lecture you will be able to Explain the derivation of the Aggregate Demand curve relating inflation and output levels and how it shifts ID: 760523

chapter inflation curve output inflation chapter output curve aggregate unemployment rate economy demand supply capacity interest higher monetary price

Share:

Link:

Embed:

Download Presentation from below link

Download Presentation The PPT/PDF document "Aggregate Supply, Aggregate Demand, and ..." is the property of its rightful owner. Permission is granted to download and print the materials on this web site for personal, non-commercial use only, and to display it on your personal computer provided you do not modify the materials and that you retain all copyright notices contained in the materials. By downloading content from our website, you accept the terms of this agreement.


Presentation Transcript

Slide1

Aggregate Supply, Aggregate Demand, and Inflation: Putting It All Together

Chapter 13

© Dünhaupt, Dullien, Goodwin, Harris, Nelson, Roach,

Torras

Slide2

Learning goals

After today‘s lecture, you will be able to:Explain the derivation of the Aggregate Demand curve relating inflation and output levels, and how it shifts.Explain the derivation of the Aggregate Supply curve relating inflation and output levels, and how it shifts.Use the AS/AD model to describe the consequences of changes in fiscal policy, monetary policy, supply shocks, and investor and consumer confidence, depending on whether an economic is in a recession or at full employment.Apply the AS/AD model to understanding major European macroeconomic developments of the last several decades.Discuss how classical and Keynesian economic theories differ in how they understand the macroeconomy.

Chapter 13

2

Slide3

Chapter outline

Aggregate Expenditure and InflationCapacity and the Aggregate Supply CurvePutting the AS/AD Model to WorkCompeting Theories

Chapter 13

3

Slide4

Aggregate Expenditure and Inflation

Slide5

From the AE-curve to the AD-curve

Reminder: The AE-curve has shown us points at which points investment and savings are in equilibrium (I=S)However, this is not the end of the storyAs discussed in chapter 12, ECB will react to inflationary pressures with higher interest ratesHigher interest rates lead to lower equilibrium AESolution: Another curve in a new diagram: The AD curveAD curve shows link between inflation and aggregate demand, including ECB reaction

Chapter 13

5

Slide6

Reminder: Figure 12.6 The ECB’s reaction function

Chapter 12

6

Interest rate (r)

Inflation rate (

π

)

If inflation rises…

…the

ECB increases interest rates

r

0

π

1

π

0

r

1

A

B

As the ECB’s primary objective is to keep inflation low and stable, it will react to increases in inflationary pressure with hikes in its main refinancing rate

Slide7

How is inflation impacting on aggregate demand?

Mechanism A: For economies with their own central bank and floating exchange rates (e.g. the whole euro area, the US, Japan etc.):if inflation increases (decreases), central bank will increase (decrease) interest rates this will dampen (increase) aggregate demand

Mechanism B: For economies without their own central bank (e.g. the single member states of the euro area):ECB looks at the overall inflation rate in the euro areasmall countries not likely to have impact on ECB’s interest rate decision But: higher inflation reduces competitiveness of exportsResult: Higher inflation leads to less aggregate demand

Chapter 13

7

Slide8

13.1 The Aggregate Demand curve

Chapter 13

8

Output (

Y

)

Inflation rate (

π

)

If inflation rises…

…the

level of Aggregate Demand falls

Y

1

π1

π0

Y0

A

B

This analysis shows the impact of different inflation levels on Aggregate Demand.

Slide9

What determines the position of the AD curve?

specific levels ofgovernment spendingtaxationautonomous consumptionautonomous investmentautonomous net exportschanges in these variables will cause the AD curve to shift

Chapter 13

9

Slide10

13.2 The Effect of Expansionary Fiscal Policy or Increased Confidence on the AD curve

Chapter 13

10

Output (

Y

)

Inflation rate (

π

)

AD0

AD

1

If government spending increases, taxes decrease, consumers or investors become more confident, or net exports increase, demand for goods in the economy

Slide11

What happens if central banks change their policy?

active form of central bank intervention:changing inflation targetfocus on fighting unemploymentsame level of inflation would result in higher (lower) real interest rates set by the central bankdampening (increasing) investment and shift the AD curve

Chapter 13

11

Slide12

Capacity and the Aggregate Supply Curve

Slide13

13.3 The Aggregate Supply curve

Chapter 13

13

Output (

Y

)

Inflation rate (

π

)

Aggregate Supply (AS)

Maximum Capacity

Y*

Unemployment

Wage-Price Spiral

As the economy approaches its maximum capacity, inflation levels tend to rise as excessive demand for workers, goods and services, and production inputs pushes up wages and prices.

Slide14

The Aggregate Supply curve at high output levels

maximum capacity output: the level of output an economy would produce if every resource in the economy were fully utilized wage-price spiral: when pressure on wages creates upward pressure on prices and, as a result, further upward pressure on wages At maxiumum capacity, inflation levels tend to rise

Chapter 13

14

Slide15

13.4 The effect of an increase in inflationary expectations on the aggregate supply curve

Chapter 13

15

Output (

Y

)

Inflation rate (

π )

AS0

AS

1

5 % -

3

% -

If people come to expect higher inflation, these expectations get built in to wage and price contracts, leading to a generally higher level of inflation throughout the economy.

Slide16

Shifts of the AS curve: inflationary expectations

if people expect higher inflation, expectations get built into wage and price contracts Inflation can be self-fulfillingin the short run: inflation rate the same as in the pastin the medium run: a rise in inflation tends to increase people’s expectations

Chapter 13

16

Slide17

Shifts of the AS curve: supply shocks

supply shock: a change in the productive capacity of an economy e.g. bumper crop in agriculture, new invention, increase in labor productivitythe real capacity of the economy expandsthe economy can produce more than beforenote: there can also be adverse supply shockse.g. natural occurrences or warreduce economy’s capacity to produce

Chapter 13

17

Slide18

Figure 13.5 A beneficial supply shock: expansion of output capacity

Chapter 13

18

Output

(

Y

)

Inflation rate (π )

AS1

AS

0

Expansion of Maximum Capacity

An expansion of output capacity could be a result of new technology or improved labor productivity

Slide19

Putting the AS/AD Model to Work

Slide20

The AS/AD model illustrates three points about the macroeconomy

fiscal and monetary policies affect output and inflationexpansionary fiscal and monetary policies tend to push the economy toward higher output. If the economy is approaching its maximum capacity, they will also cause inflation to rise.  contractionary fiscal and monetary policies tend to push the economy toward lower output. Inflation is unlikely to fall quickly, but a persistent recession will tend to lower inflation over the long term.

Chapter 13

20

Slide21

The AS/AD Model illustrates three points about the macroeconomy (cont.)

supply shock may have significant effectsadverse supply shocks lower output and raise inflationbeneficial supply shocks raise output and lower inflationinvestor and consumer confidence and expectations have important effects on output and inflation

Chapter 13

21

Slide22

We will now apply the model to a number of cases

An economy in recessionStagflation in the 1970s and 1980sA hard line against inflation: Disinflation in the 1980sAn overheated economy: The German reunificationAusterity policies and structural reforms

Chapter 13

22

Slide23

Case 1: The global financial and economic crisis 2008-2009

unemployment was high but inflation remained lowgovernments of major OECD countries passed stimulus packages with tax cuts and spending increasesstimulus packages helped European economies to recover from recessioneffects not large enough to reach full employmentinflation did not rise

Chapter 13

23

Slide24

13.6 Aggregate Demand and supply equilibrium in recession

Chapter 13

24

Output (

Y

)

Inflation rate (

π

)

AS

Y*

AD

E

0

Unemployment

The position of the AD curve indicates a low level of aggregate demand, leading to an economy with unemployment at equilibrium

E

0

. At this point on the AS curve, inflationary pressures are low.

Slide25

Figure 13.7 Expansionary fiscal policy in response to a recession

Chapter 13

25

Output (

Y

)

Inflation rate (

π

)

Y*

AD

1

AD

0

E

1

E

0

Unemployment

AS

An expansion of government spending, as well as a program of tax cuts, shifts the AD curve to the right. This reduces unemployment, but since the economy is in the flat portion of the AS curve at equilibrium

E

1

, it has little effect on inflation.

Slide26

The reaction in the U.S. was different

Fed embarked early on quantitative easingidea: combination of monetary expansion plus recovering confidence of consumers and businesses leads to a more complete recoverylarger shift in AD brings economy back to full-employment

Chapter 13

26

Slide27

Figure 13.8 A greater expansion of aggregate demand

Chapter 13

27

Output (

Y

)

Inflation rate (

π

)

Y*

AD

1

AD

0

E

1

E

0

Unemployment

AS

If Aggregate Demand increases by a larger amount, it can bring the economy back into the full employment zone. At equilibrium point

E

1

the AS/AD model indicates the possibility of a slightly higher inflation level.

Slide28

Case 2: StagflationPrelude: The 1950s and 1960s

robust economic growth and low unemploymentinflation under controlbelieve: trade-off between unemployment and inflation

Chapter 13

28

Slide29

13.9 The Phillips Curve for the U.S. in the 1960s

Chapter 13

29

Unemployment Rate (percent)

Inflation (percent per year)

In the 1960s economist A.W. Phillips identified an inverse relationship between inflation and unemployment. While this basic relationship still holds true, events of the 1970s and later showed that inflation can be much more variable than the simple Phillips principle implies.

Slide30

The 1970s

increase in inflation and unemployment1973-1974: “oil-price shock”stagflation: a combination of rising inflation and economic stagnationHow can we explain this effect ?

Chapter 13

30

Slide31

Chapter 13

31

Output (

Y

)

Inflation rate (

π )

AS0

AS

1

AD

E

1

E

0

Lower Capacity

13.10 The

effect

of the

oil price shock

of the 1970s

A drastic increase in the price of a key resource reduces the economy’s total capacity and shifts the AS curve up and to the left. Both inflation and unemployment get worse at equilibrium point E

1

.

Slide32

Figure 13.11a: German inflation and unemployment, 1969-1975

Chapter 13

32

The oil price shock of the 1970s pushed inflation in Germany only up a few percentage points and price pressure quickly subsided again. However, unemployment more than doubled.

Source:

AMECO database, 2016.

Slide33

Figure 13.11b: Italian iInflation and unemployment, 1969-1975

Chapter 13

33

In Italy, inflation surged during the oil price shock of the 1970s. However, unemployment remained almost unaffected.

Source:

AMECO database, 2016.

Slide34

How can we explain these different outcomes using our AS/AD Model?

Germany: Inflation increased during oil-price shockGerman Bundesbank increased interest ratesincrease in inflation and unemploymentItaly:increase in public spendingexpansionary monetary policy to finance part of government expenditurehigher inflation but no increase in unemployment

Chapter 13

34

Slide35

13.12 The Italian reaction to oil price shock of the 1970s

Chapter 13

35

Output (

Y

)

Inflation rate (

π )

AS0

AS

1

AD

0

E

1

E

0

Lower Capacity

E

2

AD

1

Initially, the oil price shock has led to increased unemployment and higher inflation (a movement from E

0

to E

1

). Yet, the Italian government reacted with expansionary fiscal and monetary stimulus which pushed inflation further up (to E

2

).

Slide36

This was not the end of inflation in the 1970s …

in countries like Italy, inflationary expectations permanently shifted upwardexpectation of higher inflation built into wage and price contractspermanently high inflation ratein countries like Germany and Switzerland, inflation came down by 1978

Chapter 13

36

Slide37

1980: tight monetary policy

Situation in the U.S.: high inflation led to people’s discontentRemember: high rates of inflation can wipe out people’s savings and make it difficult to plan, save, and investU.S. central bank, the Federal Reserve, under Paul Volcker, implemented very contractionary monetary policiesmost European central banks followed and increased interest ratesResult: Fall in inflation, but long recession and increase in unemployment

Chapter 13

37

Slide38

13.13 The effects of The Fed’s “tight money” policies in the 1980s

Chapter 13

38

Output (

Y

)

Inflation rate (

π

)

AS0

Y*

Unemployment

AD

0

AD

1

E

0

E

1

AS

1

E

2

A very restrictive monetary policy drives the

AD

curve sharply to the left, pushing unemployment to very high levels. But a resulting decrease in inflationary expectations shown in aggregate supply curve

AS

1

lowers inflation and allows the economy to recover to equilibrium point

E

2.

Slide39

Disinflation in the early 1980s

media reports on the commitment of central banks to bring inflation downinflation expectations fell over timeBut: significant human and economic costUnemployment stayed higher for long in Europe than in the U.S.

Chapter 13

39

Slide40

How can one explain different performance in the U.S. and Europe?

Chapter 13

40

inflexible European labor market

firms reluctant to hire new workers due to legal difficulties to get rid of them if business declines

it takes a long time of economic growth before firms start hiring and unemployment fallsunemployed workers loose skillscyclical unemployment turns into structural unemploymentlower potential output

central bankers did not lower interest rates enough

excessively tight monetary policies limited speed of Europe’s recovery

Past experience:

fear of inflationary expectations which can only be reduced by policies that cause economic pain

Slide41

Case 4: Inflation can also be caused by an overheated economy and an excess of aggregate demand

German reunification boom in the early 1990sadditional demand for consumer goodsincrease in confidence of West German firmshuge public investment program

Chapter 13

41

Slide42

13.14 Excessively high aggregate demand causes inflation

Chapter 13

42

Output (

Y

)

Inflation rate (

π

)

AS

Y*

AD

1

AD

0

E

1

E

0

Wage-Price Spiral

Expansionary policy causes the economy to “heat up.” In the short run, people respond by increasing output, but tight markets for labor and other resources cause inflation to rise as well at equilibrium point

Slide43

What happened next?

German economy hit by negative shocksBundesbank increased interest rates sharplyconsumer and investor confidence decreased1992: European Monetary System crisisdecline in German exportsdecline in inflation, rise in unemployment

Chapter 13

43

Slide44

Case 5: Austerity policies and structural reforms

euro-crisis: austerity packages and structural reformsfrom 2010, investors got concerned about debt sustainabilityhigh interest rates for borrowersEU: cut public spending, increase taxes, and implement structural reforms

Chapter 13

44

Slide45

Figure 13.15a A loss of investor confidence in the AS/AD model

Chapter 13

45

Output (

Y

)

Inflation rate (

π

)

AS

0

AD

0

E

0

E

2

E

1

AD

1

AD

2

When investors lose confidence in one country and cut credit lines to the countries’ firms, the AD curve shifts left. GDP contracts and unemployment increases.

Slide46

Figure 13.15b Structural reforms in the AS/AD model

Chapter 13

46

Output (

Y

)

Inflation rate (

π )

AS0

AS

1

AD

0

E

0

E

3

Higher

Capacity

E

2

AD

2

If the government reacts to the fall in output with reforms which increase potential output, in a second step, the AS curve shifts right. GDP increases again, but prices fall. It is not clear, however, whether a return to the initial GDP level is possible.

Slide47

Figure 13.16: Unemployment in Ireland and Greece

Chapter 13

47

During the euro crisis, unemployment both in Ireland and Greece was significantly above pre-crisis levels. However, as of 2016, unemployment in Ireland has come down significantly, while it has remained stubbornly high in Greece.

Source:

Eurostat, 2016.

Slide48

Figure 13.17: Inflation in Ireland and Greece

Chapter 13

48

Inflation fell both in Ireland and Greece after austerity packages and structural reform measures were enacted

. However, inflation fell further in Greece than in Ireland.

Source:

Eurostat, 2016.

Slide49

Figure 13.18a Macroeconomic results of austerity and structural reforms in Ireland

Chapter 13

49

Output (

Y

)

Inflation rate (

π )

AS0

AS

1

AD

0

E

0

E

3

Higher

Capacity

E

2

AD

2

As Ireland is a very open economy, falling inflation caused by structural reforms boosted exports and aggregate demand. As a consequence, structural reforms were able to counteract part of the negative impacts of austerity.

Slide50

Figure 13.18b Macroeconomic results of austerity and structural reforms in Greece

Chapter 13

50

Output (

Y

)

Inflation rate (

π )

AS0

AS

1

AD

0

E

0

E

3

Higher

Capacity

E

2

AD

2

As aggregate demand in Greece does not react much to changes in inflation, structural reforms have not been able to increase employment significantly. The combination of austerity and structural reforms has led to lower inflation, but also high unemployment.

Slide51

Competing Theories

Slide52

Was it necessary to enact expansionary scal policy in order to get the European economies out of the 2008–2009 recession?

Was it a good idea for the ECB to lower interest rates to zero (and below for deposits) in 2015–2016 to try to promote recovery?

Chapter 13

52

Slide53

Classical macroeconomics

assumptions:self-adjusting properties of free-marketslabor markets clear at an equilibrium wagemarkets for loanable funds cause savings and investment to be equal at an equilibrium interest ratein theory, a smoothly functioning economy should be at full-employment

Chapter 13

53

Slide54

13.19 The classical view of AS/AD

Chapter 13

54

Output (

Y

)

Inflation rate (

π )

Classical AS

Y*

AD

the

vertical

AS

curve

represents

the

classical

view

that

the

economy

will

tend

to

return

to

full

employment

automatically

.

Slide55

The classical view of AS/AD

AS curve at full-employment levelpeople make optimizing choicesunemployed workers bid down wagesfull-employment restoredAD level determines only the inflation rate

Chapter 13

55

Slide56

What is the effect of aggregate demand-management policies?

expansionary fiscal or monetary policy has no effect on the output level government spending “crowds out” private spending more spending by government means less spending by consumers and businesses monetary expansions lead only to increased inflationcentral bank should choose a certain growth rate of the money supply or level of the interest rate

Chapter 13

56

Slide57

Keynesian macroeconomics

market economies are inherently unstable business cycles can be explained by changes in investors’ confidencemacroeconomic phenomena cannot be explained by assuming rational, optimizing behavior by individualsinherent tendency toward market instability requires active government intervention

Chapter 13

57

Slide58

What to take home

higher inflation rates tend to reduce aggregate demand, as central banks increase interest ratefiscal and monetary policies affect output and inflationsupply shock may have significant effectsinvestor and consumer confidence and expectations have important effects on output and inflationClassical and Keynesian economists provide different arguments about economic analysis and policy

Chapter 13

58