/
The strength of the tropical inversion and its response to The strength of the tropical inversion and its response to

The strength of the tropical inversion and its response to - PowerPoint Presentation

mitsue-stanley
mitsue-stanley . @mitsue-stanley
Follow
398 views
Uploaded On 2016-03-03

The strength of the tropical inversion and its response to - PPT Presentation

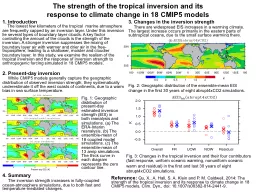
1 Introduction The lowest few kilometers of the tropical marine atmosphere are frequently capped by an inversion layer Under this inversion lie several types of boundary layer clouds A ID: 240690

strength inversion tropical simulations inversion strength simulations tropical response cmip5 models layer due boundary eis distribution fig geographic warming

Share:

Link:

Embed:

Download Presentation from below link

Download Presentation The PPT/PDF document "The strength of the tropical inversion a..." is the property of its rightful owner. Permission is granted to download and print the materials on this web site for personal, non-commercial use only, and to display it on your personal computer provided you do not modify the materials and that you retain all copyright notices contained in the materials. By downloading content from our website, you accept the terms of this agreement.


Presentation Transcript

Slide1

The strength of the tropical inversion and its response to climate change in 18 CMIP5 models

1. Introduction The lowest few kilometers of the tropical marine atmosphere are frequently capped by an inversion layer. Under this inversion lie several types of boundary layer clouds. A key factor controlling the amount of the clouds is the strength of the inversion. A stronger inversion suppresses the mixing of boundary layer air with warmer and drier air in the free-troposphere, leading to a shallower, moister and cloudier boundary layer. In this study, we examine the realism of the tropical inversion and the response of inversion strength to anthropogenic forcing simulated in 18 CMIP5 models.

2. Present-day inversion While CMIP5 models generally capture the geographic distribution of observed inversion strength, they systematically underestimate it off the west coasts of continents, due to a warm bias in sea surface temperature.

Fig. 1: Geographic distribution of present-day estimated inversion strength (EIS) in both reanalysis and simulations. (a) The ERA-Interim reanalysis. (

b) The ensemble-mean of 18 coupled model simulations. (c) The ensemble-mean of 13 amip simulations. The thick curve in each diagram represents the zero contour line.

3. Changes in the inversion strength There are widespread EIS increases in a warming climate. The largest increase occurs primarily in the eastern parts of subtropical oceans, due to the small surface warming there.

Fig. 2: Geographic distribution of the ensemble-mean EIS change in the first 30 years of eight abrupt4xCO2 simulations.

Fig. 3: Changes in the tropical inversion and their four contributors (fast response, uniform oceanic warming,

nonuniform

oceanic warm and residual) in the first and last 30 years of eight abrupt4xCO2 simulations.

4. Summary

The inversion strength increases in fully-coupled ocean-atmosphere simulations, due to both fast and temperature-mediated changes.

Reference:

Qu, X., A. Hall, S. A. Klein and P. M. Caldwell, 2014: The strength of the tropical inversion and its response to climate change in 18 CMIP5 models.

Clim

.

Dyn

.,

doi

: 10.1007/s00382-014-2441-9.