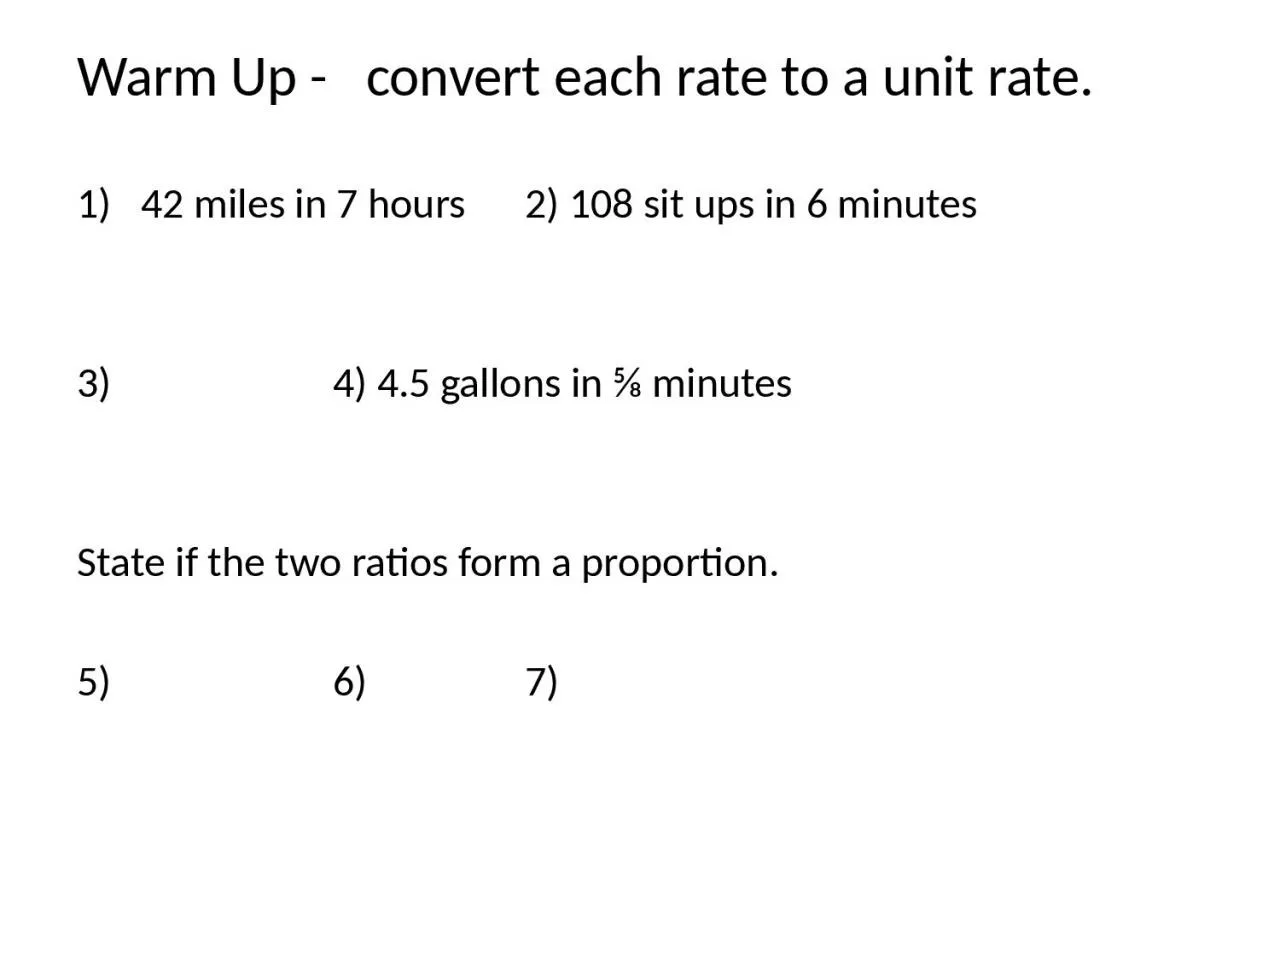
ratio and rate quiz Thursday Warm Up convert each rate to a unit rate 42 miles in 7 hours 2 108 sit ups in 6 minutes 4 45 gallons in ⅝ minutes State if the two ratios form a proportion ID: 1042754
Download Presentation The PPT/PDF document "Homework Worksheet both sides," is the property of its rightful owner. Permission is granted to download and print the materials on this web site for personal, non-commercial use only, and to display it on your personal computer provided you do not modify the materials and that you retain all copyright notices contained in the materials. By downloading content from our website, you accept the terms of this agreement.
1. HomeworkWorksheet both sides, ratio and rate quiz Thursday
2. Warm Up - convert each rate to a unit rate.42 miles in 7 hours 2) 108 sit ups in 6 minutes 4) 4.5 gallons in ⅝ minutesState if the two ratios form a proportion.5) 6) 7)
3. Homework questions
4. Learning ObjectiveStudents will learn how to interpret tables and graph proportional ratios.CCSS: CCSS: 7.RP.2
5. CCSS: 7.RP.2
6. You can determine if a relationship is proportional by looking at a table of values or the graph.How?TableIf all the ratios of numbers in the table are equivalent, the relationship is proportional.GraphIf the graph of the numbers forms a straight line through the origin (0,0), the relationship is proportional.
7. Example 1.On a field trip, every chaperone is assigned 12 students. Is the student to chaperone ratio proportional?If you use a table to demonstrate, you would need several ratios to start.Next, find the simplified ratios and compare them. Are they the same?The relationship is proportional.Chaperones12345Students 12 24 36 48 60
8. Example 2 Try this:The local pizza place sells a plain pie for $10. Each topping costs an additional $1.50. Is the cost of pizza proportional to the number of toppings purchased?Toppings1234Cost ($) 11.50 13.00 14.50 16.00Ratios: cost toppingsSince the ratios are not equivalent, the relationship is not proportional.
9. Ex 3)Is the relationship shown in the table proportional?Year1245Income$22,000$44,000$88,000$110,000YesNo
10. x2569y717.52134.5Ex 4)Is the relationship shown in the table proportional?YesNo
11. x1269y511314638Is the relationship shown in the table proportional?YesNo
12. x1247y4816355.Is the relationship shown in the table proportional?YesNo
13. x2468y-3-10-15-206.Is the relationship shown in the table proportional?YesNo
14. 123451020304050Ex 6. Does the diagram represent a proportional relationship? If so, identify the constant of proportionality.
15. 12345678910Ex 7. Does the diagram represent a proportional relationship? If so, identify the constant of proportionality.
16. Remember:TableIf all the ratios of numbers in the table are equivalent, the relationship is proportional.GraphIf the graph of the numbers forms a straight line through the origin (0,0), the relationship is proportional.
17. Example 8.On a field trip, every chaperone is assigned 12 students. Is the student to chaperone ratio proportional?Chaperones12345Students1224364860ChaperonesStudents0 1 2 3 4 5 6 7 8 9 106121824303642485460Since the graph is a straight line through the origin, the relationship is proportional.Connected points form a straight lineLine crosses through the origin(x)(y)
18. Example 9.Draw a graph to represent the relationship. Is the relationship proportional?XY15.52738.54100 1 2 3 4 5 6 7 8 9 1012345678910
19. HoursSalary ($)0 1 2 3 4 5 6 7 8 9 10510152025303540455010Is the relationship shown in the graph proportional?YesNo
20. ToppingsCost ($)0 1 2 3 4 5 6 7 8 9 10510152025303540455011.Is the relationship shown in the graph proportional?YesNo
21. Text MessagesCost ($)0 1 2 3 4 5 6 7 8 9 10510152025303540455012.Is the relationship shown in the graph proportional?YesNo
22. TeachersStudents0 1 2 3 4 5 6 7 8 9 10510152025303540455013.Is the relationship shown in the graph proportional?YesNo
23. The constant of proportionality is a constant ratio (unit rate) in any proportional relationship.We use the letter k to represent the constant of proportionality.Equations:y = kx or k = y x“x” is your independent variable“y” is your dependent variable“y” will depend on what you do to “x”. Whatever you do to “y over x” you will get k the constant.Unit rate is the relationship between the y and the x. When the x value is 1, y will be the unit rate.
24. We can find the constant of proportionality from a table of values, equation and a graph.In a table, simplify any one of the ratios.Chaperones12345Students1224364860(x)(y)
25. Apples (lbs)22.533.54Cost ($)3.964.955.946.937.92Ex 14) Find the constant of proportionality:Click (x)(y)
26. XY34.54657.5812913.5Ex15) Find the constant of proportionality:Click
27. XY21.553.75107.5129Ex 16Find the constant of proportionality.
28. XY22.533.7545911.2517Find the constant of proportionality.
29. In an equation, what does k equal.Example 18:Click Click Click
30. Find the constant of proportionality: (click to reveal)
31. In a graph, choose a point (x, y) to find and simplify the ratio. (2, 24)Find the unit rate. ChaperonesStudents0 1 2 3 4 5 6 7 8 9 106121824303642485460
32. Ex 19) Find the constant of proportionality.0 2 4 6 8 10 12 14 16 18 202468101214161820Click
33. 0 0.5 1 1.5 2 2.5 3 3.5 4 4.5 5481216202428323640Ex 20)Find the constant of proportionality.Find the unit rate.
34. Learning ObjectiveCan you interpret tables and graph proportional ratios?If not, please schedule a math clinic session!CCSS: CCSS: 7.RP.2
35. HomeworkWorksheet: Representing Proportional RelationsQuiz 7-1, 7-2 & Proportional Relationships