PPT-2D Plots 2 ENGR 1181 MATLAB 13
Author : myesha-ticknor | Published Date : 2018-11-04
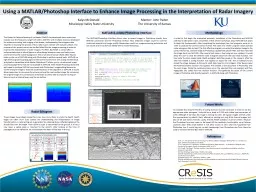
Plotting in the Real World 2D plots generated by MATLAB can be used in a variety of fields including the one shown here which is showing life expectancy vs literacy
Presentation Embed Code
Download Presentation
Download Presentation The PPT/PDF document "2D Plots 2 ENGR 1181 MATLAB 13" is the property of its rightful owner. Permission is granted to download and print the materials on this website for personal, non-commercial use only, and to display it on your personal computer provided you do not modify the materials and that you retain all copyright notices contained in the materials. By downloading content from our website, you accept the terms of this agreement.
2D Plots 2 ENGR 1181 MATLAB 13: Transcript
Download Rules Of Document
"2D Plots 2 ENGR 1181 MATLAB 13"The content belongs to its owner. You may download and print it for personal use, without modification, and keep all copyright notices. By downloading, you agree to these terms.
Related Documents