/
Authors Jon Gottschalck Vernon Kousky Wayne Higgins and Michelle LHeureux Madden Julian Authors Jon Gottschalck Vernon Kousky Wayne Higgins and Michelle LHeureux Madden Julian

Authors Jon Gottschalck Vernon Kousky Wayne Higgins and Michelle LHeureux Madden Julian - PDF document

myesha-ticknor
myesha-ticknor . @myesha-ticknor
Follow
517 views
Uploaded On 2014-12-19

Authors Jon Gottschalck Vernon Kousky Wayne Higgins and Michelle LHeureux Madden Julian - PPT Presentation

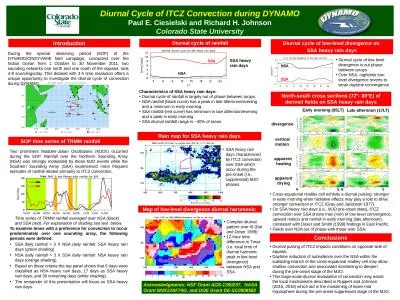
Definition The MJO is an intraseasonal fluctua tion or wave occurring in the glob al tropics The MJO is responsible for the majority of weather variability in these regi ons and results in variations in several important atmospheric and oceanic par ID: 26194

Definition The MJO

Share:

Link:

Embed:

Download Presentation from below link

Download Pdf The PPT/PDF document "Authors Jon Gottschalck Vernon Kousky Wa..." is the property of its rightful owner. Permission is granted to download and print the materials on this web site for personal, non-commercial use only, and to display it on your personal computer provided you do not modify the materials and that you retain all copyright notices contained in the materials. By downloading content from our website, you accept the terms of this agreement.


Presentation Transcript

The MJO is characterized by eastward propagation of regions of enhanced and suppressed tropical rainfall, primarily over the Indian and Pacific Oceans. The anomal Due to its slowly evolving nature, accurate prediction of the MJO is fundamentally related to our ability to monitor the feature and to assess its relative position and strength. Dynamical models generally do not predict the MJO well, partly because of the inherent difficulties that still remain regarding the correct mathematical treatment of tropical convective (rainfall) processes. Meteorologists use a variety of data and 2. The MJO can substantially modulate the intensity of monsoon systems around the globe. The Australian (boreal winter; October-March), Asian (boreal summer; June-September), South American (boreal winter,October-March) and North American (boreal summer; May-October) monsoons can all be influenced by the MJO. The enhanced rainfall phase of the MJO can affect both the timing of monsoon onset and the intensity of the monsoon. Moreover, the suppressed phase of the MJO can prematurely end a monsoon and also initiate breaks during already existing monsoons. 3. The MJO also enhances (suppresses) the intensity and extent of both the mean South Atlantic Convergence Zone (SACZ; Brazilian coast) and South Pacific Convergence Zone (SPCZ; east of Australia) (Kousky and Kayano, 1994; Matthews et al. 1996; Carvalho et al. 2004). 4. There is evidence that the MJO influences the ENSO Niño, but can contribute to the speed of development, and perhaps the overall intensity of El Niño episodes (Kessler and Kleeman, 2000; Zhang and Gottschalck, 2002). The MJO is known to modulate tropical cyclone activity in the Indian Ocean, Pacific Ocean, Gulf of Mexico, and Atlantic Ocean (Maloney and Hartmann, 2000a; Maloney and Hartmann, 2000b; Higgins and Shi, 2001). For example, although tropical cyclones occur throughout the Northern Hemisphere warm season (typically May-November) in both the Pacific and the Atlantic basins, in any given year there are periods of enhanced / suppressed activity within the season. The MJO modulates this activity (particularly for the strongest storms) by providing a large-scale environment that is favorable (unfavorable) for development. For example, westerly wind anomalies at the surface in and just behind the area of enhanced convection of the MJO may generate cyclonic (anticyclonic) rotation north (south) of the equator respectively (Figure 2). At the same time, in the upper levels, anticyclonic (cyclonic) rotation develops along and just behind the area of convection (Figure 2) resulting in a means to reduce vertical wind shear and increase upper-level divergence – both of which are favorable for tropical cyclone development and intensification. The strongest tropical cyclones tend to develop when the MJO favors enhanced precipitation. As the MJO progresses eastward, the favored region for tropical cyclone activity also shifts eastward from the Indian Ocean to the Pacific Ocean and eventually to the Atlantic Ocean (Figure 10). While this relationship appears robust, we caution that the MJO is one of many factors that contribute to the development of tropical cyclones. For example, it is well known that SSTs must be sufficiently warm and vertical wind shear must be sufficiently weak for tropical disturbances to form and persist. 6. Enhanced tropical rainfall in the western and central Pacific can contribute to extreme rainfall events in western North America (Higgins et al. 2000). The typical scenario linking the pattern of tropical rainfall associated with the MJO to extreme precipitation events in the Pacific Northwest features a progressive (i.e. eastward moving) circulation pattern in the tropics and a retrograding (i.e. westward moving) circulation pattern in the high latitudes of the North Pacific (Figure 11). VII. References Carvalho, L, C. Jones, B. Liebmann, 2004: The South Atlantic convergence zone: Intensity, Form, Persistence, and relationships with intraseasonal to interannual activity and extreme rainfall. J. Climate88-108. Hendon, H., C. Zhang, and J. Glick, 1999: Interannual variation of the Madden-Julian Oscillation during Austral summer. J. Climate, 12, 2538-2550. Higgins, W., J. Schemm, W. Shi, and A. Leetmaa, 2000: Extreme precipitation events in the western United States related to tropical forcing. J. Climate, 13, 793-820. Higgins, W and W. Shi, 2001: Intercomparison of the principal modes of interannual and intraseasonal variability of the North American monsoon system. J. Climate, 14, 403-417. Jones, C. and L. Carvalho, 2002: Active and Break phases in the South American Monsoon System, J. Climate, 15, 905-914. Figure 1 : Equatorial vertical cross section of the MJO as it propagates from the Indian Ocean to the western Pacific. Red arrows indicate direction of wind and red (blue) SST labels indicate positive (negative) SST anomalies respectively. Figure adapted from Madden and Julian, 1971; 1972. Figure 2 : Schematic of the vertical three-dimensional structure of an established MJO. Figure adapted from Rui and Wang (1990). Blue (red) ovals indicate anticyclonic (cyclonic) circulations. Black arrows indicate wind direction and rising (sinking) motion. Figure 3 : Time longitude plots of 200-hPa velocity potential for the June through September time period for (a) 1989-1990 (La Nina conditions), (b) 1996-1997 (ENSO neutral conditions), and (c) 1997-1998 (El Nino conditions). Figure 4a : Composites of 200-hPa velocity potential (m/s) for eight phases of the MJO cycle for the November through March time period. The anomalies are shown with contours and regions that are statistically significant (at the 95% confidence level based on a Student-t test) are shaded. Figure 5a : Same as figure 4a except for OLR. Units are in Wm Figure 6a : Same as figure 4a except for precipitation. Units are in mm. Figure 7a : Same as figure 4a except for 850 mb wind vectors and velocity potential (shading). Units for velocity potential are m Figure 8a : Same as figure 4a except for sea level pressure. Units are in hPa. 1. Alternating periods of wetter/drier conditions in the tropics 2. ”Pineapple express” heavy rainfall events 3. Modulation of monsoon systems 4. Influence on tropical cyclone development 5. Modulation of ENSO cycle through oceanic Kelvin waves 1. Alternating periods of wetter/drier conditions in the tropics 2. Modulation of monsoon systems 3. Influence on tropical cyclone development Figure 9 : Regions and impacts where MJO activity has been shown to influence weather conditions during the 1-3 week time frame.