/
Consumer Price Index Consumer Price Index

Consumer Price Index - PowerPoint Presentation

myesha-ticknor
myesha-ticknor . @myesha-ticknor
Follow
441 views
Uploaded On 2016-11-05

Consumer Price Index - PPT Presentation

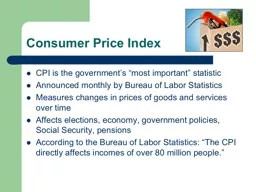
CPI is the governments most important statistic Announced monthly by Bureau of Labor Statistics Measures changes in prices of goods and services over time Affects elections economy government policies Social Security pensions ID: 484936

cpi dollars tuition index dollars cpi index tuition price 2001 2011 371 rose carleton

Share:

Link:

Embed:

Download Presentation from below link

Download Presentation The PPT/PDF document "Consumer Price Index" is the property of its rightful owner. Permission is granted to download and print the materials on this web site for personal, non-commercial use only, and to display it on your personal computer provided you do not modify the materials and that you retain all copyright notices contained in the materials. By downloading content from our website, you accept the terms of this agreement.


Presentation Transcript

Slide1

Consumer Price Index

CPI is the government’s “most important” statisticAnnounced monthly by Bureau of Labor StatisticsMeasures changes in prices of goods and services over timeAffects elections, economy, government policies, Social Security, pensionsAccording to the Bureau of Labor Statistics: “The CPI directly affects incomes of over 80 million people.”Slide2

CPI

http://www.bls.gov/news.release/pdf/cpi.pdfHow to compare prices from year to year?Carleton’s tuition 2001: $25,371Carleton’s tuition 2016: $50,874Did the price really go up after inflation?Carleton’s tuition in 1956: $730.00Slide3

CPI is an Index Number

An index number measures the value of a variable relative to a base period (the percent change from a base period)

Carleton’s 2016 tuition relative to 2001

(50,874 / 25,371 ) x 100 = 200.52

Carleton tuition index number for 2016, with 2001 as base period, is 200.52

Tuition has increased 100.52% since 2001

What is Carleton’s tuition index number relative to 1956? How much has tuition increased since 1956?Slide4

Fixed market basket price index

What about inflation?CPI attempts to index the price of all goods and servicesCPI is an index number for the total cost of a fixed collection of goods and servicesThis is called a fixed market basket price index and is based on hundreds of itemsSlide5

Good/service

1980 quantity

1980 price

1980 cost

Pizza

100

$7 each

$700

Textbooks

20

$40 each

$800

Haircuts5$5 each$25Total cost$1,525

Good/service1980 quantity2016 price2016 costPizza100$16 each$1,600Textbooks20$100 each$2,000Haircuts5$12 each$60Total cost$3,660

Fixed market baskets for a

student price indexSlide6

Student Price Index (SPI)

SPI will compare the cost of the same collection of goods and services over timeThe same goods and services that cost $1,525 in 1980, cost $3,660 today.SPI for 2016 with 1980 as a base period is

(3660/1525) x 100 = 240.00

Student prices increased 140% from 1980 to 2016, almost one-and-a-half times.Slide7

Using the CPI

CPI is a market basket price index based on hundreds of itemsCPI base period is 1982-84: “1982-84 = 100”Having an annual price index allows us to convert amounts at different times into dollars of the same yearHistorically 20th century was time of inflation---prices rose throughout the century increasing rapidly after 1973Slide8
Slide9
Slide10

CPI

More CPIsCPI for 2015, 2016?Consumer Price Index

Year

CPI

2004

188.9

2005

195.3

2006

201.6

2007

207.342

2008215.3032009214.5372010218.0562011224.939Slide11

Adjusting for changes

in buying power “Constant dollars,” “real income” means dollars represent same buying power even though they may describe different yearsBasic Conversion Formula: To convert an amount in dollars at time A to the amount with the same buying power at time B:Slide12

Examples – Carleton’s tuition

2001: $25,371 vs. 2011: $42,690Tuition rose nominally from $25,371 to $42,690Nominal tuition rose (42690-25371)/25371 = 68.26%

But the comparison should be made in

constant dollars

2011 dollars

= 2001 dollars * (2011 CPI/2001 CPI)

= $25,371 * (224.939/177.1) = $32,224

$25,371 2001 dollars = $32,224 2011 dollars

In constant (2011) dollars, tuition rose from $32,224 to $42,690

Tuition rose

in real terms

by (42690-32224)/32224 = 32.5%Slide13

Examples – Carleton’s tuition

2001: $25, 371 vs. 2011: $42,690We could have done the calculation in constant 2001 dollars instead of 2011 dollars2001 dollars = 2011 dollars * (2001 CPI/2011 CPI)

= $42,690 * (177.1/224.939) = $33,611

So $42,690 2011 dollars is equal to $33,611 2001 dollars

In constant (2001) dollars, tuition rose from $25,371 to $33,611

Tuition rose

in real terms

by (33,611-25,371)/25,371 = 32.5%

We get the same percentage increase as before because we’re working in constant dollarsSlide14

Example – Pizza

1962: The price of a slice of pizza in Boston’s Park Street subway station was 25¢In today’s prices that is(25¢) * (224.939 / 30.2) = 186.21¢ = $1.86A pizza slice that’s $2.50 today rose (2.50-.25)/.25 = 9 = 900% (10 fold) in nominal terms.

The price has increased (2.50-1.86)/1.86 = 0.34 = 34% in real dollarsSlide15

Notes on the CPI

The CPI represents the purchases of people living in urban areas (covers about 80% of U.S. population)The market basket (goods and services) is determined by the Consumer Expenditure Survey of 29,000 households (they use random sampling)

Prices are also determined by surveys (80,000 prices in 85 cities at a representative sample of stores)Slide16

Federal Minimum Wage

(1960-2016)Restate the federal minimum wage in 1975 dollars

Make two line graphs on the same axes, showing the actual wage and the

real

wage in

1975 dollars

Explain what your graph shows about the history of the minimum wage

How much has the

federal minimum

wage

changed

since

1975, both nominally and in real terms?YearMinimum Wage1960$1.001965$1.251970$1.601975$2.101980$3.101985$3.351990$3.801995$4.25

2000200520102015$5.15$5.15$7.25$7.25