/
Generative Models of Images of Objects Generative Models of Images of Objects

Generative Models of Images of Objects - PowerPoint Presentation

myesha-ticknor
myesha-ticknor . @myesha-ticknor
Follow
400 views
Uploaded On 2015-12-02

Generative Models of Images of Objects - PPT Presentation

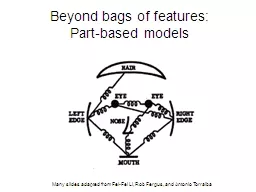
S M Ali Eslami Joint work with Chris Williams Nicolas Heess John Winn June 2012 UoC TTI Classification Localization ForegroundBackground Segmentation Partsbased Object Segmentation Segment this ID: 211745

shape model shapes images model shape images shapes appearances factored learning parts object segmentation units shapebm training hidden appearance

Share:

Link:

Embed:

Download Presentation from below link

Download Presentation The PPT/PDF document "Generative Models of Images of Objects" is the property of its rightful owner. Permission is granted to download and print the materials on this web site for personal, non-commercial use only, and to display it on your personal computer provided you do not modify the materials and that you retain all copyright notices contained in the materials. By downloading content from our website, you accept the terms of this agreement.


Presentation Transcript

Slide1

Generative Models of Images of Objects

S. M. Ali EslamiJoint work withChris WilliamsNicolas HeessJohn Winn

June 2012UoC TTISlide2
Slide3

ClassificationSlide4

LocalizationSlide5

Foreground/Background

SegmentationSlide6

Parts-based Object

SegmentationSlide7

Segment this

This talk’s focusSlide8

The segmentation task

8

The image

The segmentationSlide9

The segmentation task

The generative approachConstruct joint model of image and segmentationLearn parameters given datasetReturn probable segmentation at test timeSome benefits of this approach

Flexible with regards to data:Unsupervised training,Semi-supervised training.Can inspect quality of model by sampling from it9Slide10

Outline

FSA – Factoring shapes and appearancesUnsupervised learning of parts (BMVC 2011)

ShapeBM – A strong model of FG/BG shapeRealism, generalization capability (CVPR 2012)MSBM

– Parts-based object segmentationSupervised learning of parts for challenging datasets10Slide11

Factored Shapes and Appearances

For

Parts-based Object Understanding (BMVC 2011)Slide12

12Slide13

13Slide14

Factored Shapes and Appearances

GoalConstruct joint model of image and segmentation.Factor appearancesReason about shape

independently of its appearance.Factor shapesRepresent objects as collections of parts.

Systematic combination of parts generates objects’ complete shapes.Learn everythingExplicitly model variation of appearances and shapes.14Slide15

Factored Shapes and Appearances

15Schematic diagramSlide16

Factored Shapes and Appearances

16Graphical modelSlide17

Factored Shapes and Appearances

17Shape modelSlide18

Factored Shapes and Appearances

18Shape modelSlide19

Factored Shapes and Appearances

Continuous parameterizationFactor appearancesFinds probable assignment of pixels to parts without having to enumerate all part depth orderings.

Resolves ambiguities by exploiting knowledge about appearances.19Shape modelSlide20

Factored Shapes and Appearances

20Handling occlusionSlide21

Factored Shapes and Appearances

GoalInstead of learning just a template for each part, learn a distribution over such templates.Linear latent variable model

Part l ’s mask is governed by a Factor Analysis-like distribution:where is a low-dimensional latent variable, is the factor loading matrix and is the mean mask.

21Learning shape variabilitySlide22

Factored Shapes and Appearances

22Appearance modelSlide23

Factored Shapes and Appearances

23Appearance modelSlide24

Factored Shapes and Appearances

GoalLearn a model of each part’s RGB values that is as informative as possible about its extent in the image.Position-agnostic appearance modelLearn about distribution of colors

across images,Learn about distribution of colors within images.Sampling processFor each part:

Sample an appearance ‘class’ for each part,Samples the parts’ pixels from the current class’ feature histogram.24Appearance modelSlide25

Factored Shapes and Appearances

25Appearance modelSlide26

Factored Shapes and Appearances

Use EM to find a setting of the shape and appearance parameters that approximately maximizes :Expectation: Block Gibbs and elliptical slice sampling (Murray et al., 2010) to approximate ,

Maximization: Gradient descent optimization to find where 26

LearningSlide27

Existing generative models

27A comparison

Factored

partsFactored shape and appearanceShape variability

Appearance variability

LSM

Frey

et al.

(layers)

(FA)

(FA)

Sprites

Williams and

Titsias

(layers)

LOCUS

Winn and

Jojic

(deformation)

(colors)

MCVQ

Ross and

Zemel

(templates)

SCA

Jojic

et al.

(convex)

(histograms)

FSA

(

softmax

)

(FA)

(histograms)Slide28

ResultsSlide29

Learning a model of cars

29Training imagesSlide30

Learning a model of cars

Model detailsNumber of parts: 3Number of latent shape dimensions: 2Number of appearance classes: 530Slide31

Learning a model of cars

31Shape model weights

Convertible – CoupeLow – HighSlide32

Learning a model of cars

32Latent shape spaceSlide33

Learning a model of cars

33Latent shape spaceSlide34

Other datasets

34Training data

Mean model

FSA samplesSlide35

Other datasets

35Slide36

Segmentation benchmarks

DatasetsWeizmann horses: 127 train – 200 test.Caltech4:Cars: 63 train – 60 test,Faces: 335 train – 100 test,Motorbikes: 698 train – 100 test,

Airplanes: 700 train – 100 test.Two variantsUnsupervised FSA: Train given only RGB images.Supervised FSA: Train using RGB images + their binary masks.

36Slide37

Segmentation benchmarks

37

Horses

CarsFacesMotorbikes

Airplanes

GrabCut

Rother

et al.

83.9%

45.1%

83.7%

82.4%

84.5%

Borenstein

et al.

93.6%

LOCUS

Winn and

Jojic

93.1%

91.4%

Arora

et al.

95.1%

92.4%

83.1%

93.1%

ClassCut

Alexe

et al.

86.2%

93.1%

89.0%

90.3%

89.8%

Unsupervised FSA

87.3%

82.9%

88.3%

85.7%

88.7%

Supervised FSA

88.0%

93.6%

93.3%

92.1%

90.9%Slide38

The Shape Boltzmann Machine

A Strong Model of Object Shape (CVPR 2012)Slide39

What do we mean by a model of shape?

A probabilistic distribution:Defined on binary imagesOf

objects not patchesTrained using limited training data

39Slide40

Weizmann horse dataset

40Sample training images327 imagesSlide41

What can one do with an ideal shape model?

41SegmentationSlide42

What can one do with an ideal shape model?

42Image completion

Slide43

What can one do with an ideal shape model?

43Computer graphicsSlide44

What is a strong model of shape?

W

e define a

strong

model of object shape as one which meets two requirements:

44

Realism

Generates samples

that look realistic

Generalization

Can generate samples that

differ from training images

Training images

Real distribution

Learned distributionSlide45

Existing shape models

45A comparison

Realism

GeneralizationGlobally

Locally

Mean

Factor Analysis

Fragments

Grid MRFs/CRFs

High-order

potentials

~

Database

ShapeBM

✓Slide46

Existing shape models

46Most commonly used architecturesMRF

Mean

sample from the model

s

ample from the modelSlide47

Shallow and Deep architectures

47Modeling high-order and long-range interactions

MRF

RBM

DBMSlide48

From the DBM to the ShapeBM

48Restricted connectivity and sharing of weights

DBM

ShapeBMLimited training data. Reduce the number of parameters:

Restrict connectivity,

Restrict capacity,

Tie parameters.Slide49

Shape Boltzmann Machine

49Architecture in 2D

Top hidden units capture object poseGiven the top units,

middle hidden units capture local (part) variabilityOverlap helps prevent discontinuities at patch boundariesSlide50

ShapeBM inference

50Block-Gibbs MCMC

image

reconstructionsample 1sample n

~500 samples per secondSlide51

ShapeBM learning

Maximize with respect to Pre-trainingGreedy, layer-by-layer, bottom-up,‘Persistent CD’ MCMC approximation to the gradients.

Joint trainingVariational + persistent chain approximations to the gradients,Separates learning of local and global shape properties.

51Stochastic gradient descent

~2-6 hours on the

small datasets

that we considerSlide52

ResultsSlide53

Weizmann horses – 327 images

– 2000+100 hidden units

Sampled shapes

53

Evaluating the Realism criterion

Weizmann horses – 327

images

Data

FA

Incorrect generalization

RBM

Failure to learn variability

ShapeBM

Natural shapes

Variety of poses

Sharply defined details

Correct number of legs (!)Slide54

Weizmann horses – 327 images

– 2000+100 hidden units

Sampled shapes

54

Evaluating the Realism criterion

Weizmann horses – 327

imagesSlide55

Sampled shapes

55Evaluating the Generalization criterionWeizmann horses – 327 images – 2000+100 hidden units

Sample from the ShapeBM

Closest image in training dataset

Difference between the two imagesSlide56

Interactive GUI

56Evaluating Realism and GeneralizationWeizmann horses – 327 images – 2000+100 hidden unitsSlide57

Imputation scores

Collect 25 unseen horse silhouettes,Divide each into 9 segments,

Estimate the conditional log probability of a segment under the model given the rest of the image,Average over images and segments.

57Quantitative comparisonWeizmann horses – 327 images – 2000+100 hidden units

Mean

RBM

FA

ShapeBM

Score

-50.72

-47.00

-40.82

-28.85Slide58

Multiple object categories

Train jointly on 4 categories without knowledge of class:58

Simultaneous detection and completionCaltech-101 objects – 531 images – 2000+400 hidden units

Shape

completion

Sampled

shapesSlide59

What does h2 do?

Weizmann horsesPose information

59

Multiple categories

Class label information

Number of training images

AccuracySlide60

A Generative Model of Objects

For

Parts-based Object Segmentation (under review)Slide61

Joint Model

61Slide62

Joint model

62Schematic diagramSlide63

Multinomial Shape Boltzmann Machine

63Learning a model of pedestriansSlide64

Multinomial Shape Boltzmann Machine

64Learning a shape model for pedestriansSlide65

Inference in the joint model

SeedingInitialize inference chains at multiple seeds.Choose the segmentation which (approximately) maximizes likelihood of the image.CapacityResize inferences in the shape model at run-time.

SuperpixelsUser image superpixels to refine segmentations.65Practical considerationsSlide66

66Slide67

67Slide68

Quantitative results

68

PedestriansFG

BGUpperLower

Head

Average

Bo and Fowlkes

73.3%

81.1%

73.6%

71.6%

51.8%

69.5%

MSBM

71.6%

73.8%

69.9%

68.5%

54.1%

66.6%

Top Seed

61.6%

67.3%

60.8%

54.1%

43.5%

56.4%

Cars

BG

Body

Wheel

Window

Bumper

Average

ISM

93.2%

72.2%

63.6%

80.5%

73.8%

86.8%

MSBM

94.6%

72.7%

36.8%

74.4%

64.9%

86.0%

Top Seed

92.2%

68.4%

28.3%

63.8%

45.4%

81.8%Slide69

Summary

Generative models of images by factoring shapes and appearances.The Shape Boltzmann Machine as a strong model of object shape.The Multinomial Shape Boltzmann Machine as a strong model of parts-based object shape.

Inference in generative models for parts-based object segmentation.69Slide70

Questions

"Factored Shapes and Appearances for Parts-based Object Understanding"S. M. Ali Eslami, Christopher K. I. Williams (2011)British Machine Vision Conference (BMVC), Dundee, UK

"The Shape Boltzmann Machine: a Strong Model of Object Shape"S. M. Ali Eslami, Nicolas Heess and John Winn (2012)Computer Vision and Pattern Recognition (CVPR), Providence, USA

MATLAB GUI available athttp://arkitus.com/Ali/Slide71

Shape completion

71Evaluating Realism and GeneralizationWeizmann horses – 327 images – 2000+100 hidden unitsSlide72

Constrained shape completion

72Evaluating Realism and GeneralizationWeizmann horses – 327 images – 2000+100 hidden units

ShapeBM

NNSlide73

Further results

73Sampling and completionCaltech motorbikes – 798 images – 1200+50 hidden units

Training

imagesShapeBM samplesSamplegeneralization

Shape

completionSlide74

Further results

74Constrained completionCaltech motorbikes – 798 images – 1200+50 hidden units

ShapeBM

NN