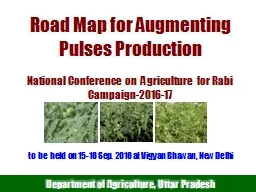
/
National Conference on Agriculture  for RABI 2016-17 National Conference on Agriculture  for RABI 2016-17

National Conference on Agriculture for RABI 2016-17 - PowerPoint Presentation

myesha-ticknor
myesha-ticknor . @myesha-ticknor
Follow
378 views
Uploaded On 2017-12-25

National Conference on Agriculture for RABI 2016-17 - PPT Presentation

Month wise Average ltFigures in LMTgt Product Requirement Availability Sales Urea 2501 4174 2365 DAP 867 1660 582 MOP 292 430 196 NPK 886 1600 602 AVAILABILITY OF FERTILIZERS DURING KHARIF 2016 ID: 617835

2015 nil 2016 fertilizers nil 2015 fertilizers 2016 marketing urea promotion state pradesh city compost figures black amp lmt

Share:

Link:

Embed:

Download Presentation from below link

Download Presentation The PPT/PDF document "National Conference on Agriculture for ..." is the property of its rightful owner. Permission is granted to download and print the materials on this web site for personal, non-commercial use only, and to display it on your personal computer provided you do not modify the materials and that you retain all copyright notices contained in the materials. By downloading content from our website, you accept the terms of this agreement.


Presentation Transcript

Slide1

National Conference on Agriculture for RABI 2016-17Slide2

Month wise Average

<Figures in LMT>

ProductRequirementAvailabilitySales

Urea25.0141.7423.65DAP

8.67

16.60

5.82

MOP2.924.301.96NPK8.8616.006.02

AVAILABILITY OF FERTILIZERS DURING KHARIF 2016

(APRIL’16 TO AUGUST’16).Slide3

<Figures in LMT>

There was no scarcity of any fertilizers.

ProductRequirementAvailabilitySales

Urea125.06135.20118.23DAP

43.33

44.61

29.17

MOP14.6012.519.79NPK44.3142.7230.31

Cumulative Requirement, Availability and Sales during Kharif-16Slide4

Requirement Assessed in Zonal Conference for RABI 2016-17.<Figures in LMT>

UREA

DAPMOPNPK

SSPTotal151.3252.4518.40

53.70

33.57

309.44

* Without reserve allocation.Slide5

All the fertilizers manufacturing companies have been asked to produce at their full capacity and about 120 LMT production expected.

OMIFCO plants producing at full capacity and about 9.60 LMT import expected.

Pending finalisation of Requirement of Urea for Rabi 2016-17, tender for import has already been floated. Steps taken by DOF to ensure availability of fertilizers during Rabi 2016-17.Slide6

Figures in Lakh Metric Tonnes

Sales of Urea during last five years 2011-12 to 2015-16

(April to March)Slide7

Figures in Lakh Metric Tonnes

Sales of P&K Fertilizers (DAP,MOP & NPK) during 2011-12 to 2015-16

(April to March)Slide8

After introduction of neem coated urea, requirement should go-down.

Extensive awareness campaign amongst farmers needed to explain the benefit of neem coated urea.

Close coordination with suppliers and timely placement of indents with Railways.Clear pending B1 & B2 forms, so that companies are financially sound to supply fertilizers.Faster release of fertilizer rakes.

Strengthen enforcement measures to prevent hoarding/ black-marketing/ smuggling/ diversion of subsidized fertilizers.Expectation from States.Slide9

Deteriorating balance in NPKSlide10

Deteriorating balance in NPKThe N-P-K ratio worsened acutely in certain statesSlide11

Suggested Medium term Strategy

Use of optimal dose based on soil health status.

Promotion of Neem-Coated Urea.Promotion of Micronutrients.Promotion of Organic Fertilizers, city compost.Promotion of Water Soluble Fertilizer under NHM.Slide12

City Compost

The Policy on promotion of City Compost has been notified on 10.02.2016. The salient features of the policy are as follows: Market development assistance in the form of fixed amount of Rs. 1500 per tonne of City Compost for scaling up production and consumption of the product. Marketing and promotion of city compost through the existing fertilizer companies.Fertilizer companies and marketing entities to co-market City Compost with chemical fertilizers through their dealers’ network.State level Steering Committee to meet regularly.Slide13

State wise record of

Cases

of Smuggling, Black Marketing and Diversion of Urea for Industrial UseStateYearSmugling

Black MarketingDiversonAndhra Pradesh2015-16NIL

NIL

NIL

Assam

2015-16NILNILNILBihar2015-16   Chhattisgarh

2015-16


Gujarat

2015-16

NIL

NIL

2

Haryana

2015-16


Himachal Pradesh

2015-16


Jammu & Kashmir

2015-16


Jharkhand

2015-16


Karnatka

2015-16


Kerala,

2015-16

NIL

NIL

3

Madhya Pradesh

2015-16


Maharashtra

2015-16


 Slide14

State wise record of

Cases of Smuggling, Black Marketing and Diversion of Urea for Industrial UseStateYearSmugling

Black MarketingDiversonManipur2015-16 


Orissa

2015-16   Pondicherry2015-16NILNILNILPunjab

2015-16


Rajasthan

2015-16


Tamil Nadu

2015-16


Uttar Pradesh

2015-16

NIL

NIL

NIL

Uttrakhand

2015-16


West Bengal

2015-16


Telangana

2015-16


Nagaland

2015-16

NIL

NIL

NIL

Delhi

2015-16

NIL

8

NIL

Daman & Diu

2015-16

NIL

NIL

NIL

Goa

2015-16

NIL

NIL

NIL

Andaman and Nicobar

2015-16

NIL

NIL

NIL

Meghalaya

2015-16

NIL

NIL

NIL

Mizoram

2015-16

NIL

NIL

NIL

2015-16 Total

0

8

5Slide15

State-wise

Unloading of Railway Rake Detention for the month of April, 2016 to August, 2016

(Detention more than 10 hours) Cumulative Data

StatesTotal RakesDetain< 15 hr15 to 24 Hr

>24 hr

Max Detention

ANDHRA PRADESH

4522192141957.20KARNATAKA40919618825

42.00

KERALA

17

7

10

0

24.00

TAMIL NADU

85

34

48

3

45.00

GUJARAT

184

114

63

7

34.10

MADHYA PRADESH

325

156

140

29

61.30

CHATTISH GARH

207

87

90

30

56.40

MAHARASHTRA

587

306

254

27

50.00

RAJASTHAN

213

110

82

21

54.00Slide16
Slide17

Thank you