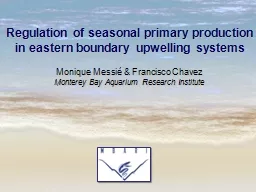
in eastern boundary upwelling systems Monique Messié amp Francisco Chavez Monterey Bay Aquarium Research Institute Regulation of seasonal primary production in eastern boundary upwelling systems ID: 384509
Download Presentation The PPT/PDF document "Regulation of seasonal primary productio..." is the property of its rightful owner. Permission is granted to download and print the materials on this web site for personal, non-commercial use only, and to display it on your personal computer provided you do not modify the materials and that you retain all copyright notices contained in the materials. By downloading content from our website, you accept the terms of this agreement.
Slide1
Regulation of seasonal primary productionin eastern boundary upwelling systems
Monique Messié & Francisco ChavezMonterey Bay Aquarium Research InstituteSlide2
Regulation of seasonal primary productionin eastern boundary upwelling systems
Monique Messié & Francisco ChavezMonterey Bay Aquarium Research
Institute
n
itrate
supply
(N flux) ↔ potential new production (C flux)
nitrate
supply
(NO
3
-
)
regeneration
(NH4+)
primary production
regenerated
new
coast
surface
mixed layer depth
150 kmSlide3
Average
primary production
vs.
potential new production
(nitrate supply)Slide4
X
Nitrate
supply
=
nitrate
at
depth
(60m)1. The N-ratio concept
satellite-derived primary production (Behrenfeld & Falkowski, 1997)
nitrate
supply
(NO
3
-
)
regeneration
(NH
4
+
)
p
rimary
production
regenerated
new
coast
surface
mixed layer
depth
wind
coastal
transport
Ekman
pumping
150 km
Comparing
primary production
and
nitrate suppl
y
from satellite winds and in-situ nitrate
(Messié et al., 2009)Slide5
1.
The N-ratio concept
carbon-equivalent of nitrate supply assuming C:N = 106:16
(Messié et al., 2006)
satellite-derived primary production
(
Behrenfeld & Falkowski, 1997)
nitrate
supply
(NO
3
-
)
regeneration
(NH4+
)primary production
regenerated
new
coast
surface
mixed layer depth
wind
Ekman
pumping
coastal
transport
nitrate
at
depth
(60m)
X
150 km
Nitrate
supply
=
Potential new production
= new production that would be achieved if all nitrate supplied was consumed
Comparing
primary
production
and
potential
new
productionSlide6
1.
N-ratio concept
PP
Seasonal
primary production
time
latitudeSlide7
1.
N-ratio concept
PP
Seasonal
primary production
vs.
potential new production
time
latitude
NP
potSlide8
RP
150 km
nitrate
supply
(NO
3
-
)
regeneration
(NH
4
+
)
potential
RPpotential NPcoastsurface
mixed layer depth
available
N
p
rimary
production
RP
NP
photo-
synthesis
N-
remain
non-
used
nitrate
accumulation
subduction
offshore export
N-ratio
* PP
f-ratio
* PP
N-ratio =
1.
N-ratio concept
N-ratio = f-ratio
if
all nitrate
supplied
is
consumed
f-ratio =
(
Eppley
& Peterson, 1979)
N-ratio =
f-ratio
+
RP =
regenerated
production
NP = new productionSlide9
N-ratio =
1.
N-ratio concept
f-ratios
(
Laws
et al. 2000;
Dunne et al., 2005)N-ratios(Eppley & Peterson, 1979)
f-ratio =
(Eppley & Peterson, 1979) f-ratio ~ 0.5
, constantN-ratio = f-ratio +
Slide10
f-ratio ~
0.5, constant
1.
N-ratio concept
N-ratio
Black contours = surface nitrate
N-ratio = f-ratio
all nitrate supplied is consumed
nitrate regulatingN-ratio > f-ratioremaining nitrateother factors regulating
N-ratio = f-ratio +
f-ratiosN-ratios
N-ratio ≤ 0.5 N-ratio ≥ 0.8Slide11
Nitrate regulation
N-ratio ≤ 0.5
nitrate regulates PP (N-remain ~ 0)
N-ratio
2.
The N-ratio analysis:
nitrate vs. other factors
N-ratio ≤ 0.5
nitrate regulates PP (N-remain ~ 0) N-ratio ≥ 0.8 other factors regulate PP (N-remain > 0)
??
??PP lower than expected from N-supply WHY??Slide12
2
. N-ratio analysis
back to the definition of primary
production
…
PP, physical export,
mortality, sinking, grazingTemperature,
speciesLight, nutrients
growth ratemax growth rate0 ≤ ≤ 1 limitation term
coast
surface
mixed layer
depth
biomass
*
growth
Temperature
Light
150 km
Physical
export
residence time
T
box
wind-driven
downwelling
EKE
shelf width
W
shelf
Iron
supply
dust deposition, river runoff
(Johnson et al., 1999)
(Chase et al., 2007)
Data sources:
QuikSCAT
winds, ETOPO2 bathymetry
, modeled dust from
Mahowald
et al. (2003
), SST Reynolds,
SeaWiFS
PAR, AVISO sea level anomalies
Nitrate
supply
(Messié et al., 2006)
PP,
physical export
,
mortality, sinking, grazing
Light
, nutrients
(
nitrate
,
iron
)
(
nitrate
)
Temperature
,
speciesSlide13
A few words about physical export
…Needs:
T
box
≤ 8 days (Zimmerman et al., 1987; Wilkerson et al., 2006) a mechanism to subduct within the box: EKE
(increases offshore & vertical export of biomass & nutrients, Lathuilière et al., 2010; Gruber et al., 2011) and/or Ekman downwelling
only observed when computing
Tbox up to Dupwell
coast
surface
mixed layer
depth
wind
Ekman
pumping
coastal
transport
150 km
upwelling
Ekman
pumping
D
upwell
(Ekman
downwelling
)
downwellingSlide14
A few words about physical export
…
Needs:
T
box
≤ 8 days (Zimmerman et al., 1987; Wilkerson et al., 2006) a mechanism to subduct within the box: EKE
and/or Ekman downwelling
only observed when computing Tbox up to Dupwell
+ isopycnal advection, mixing & frontal convergence possible (Washburn et al., 1991; Bograd & Mantyla, 2005)Slide15
2
. N-ratio analysis
Physical export
Light
Iron
T
box
EKE
Ek
neg
PARMLDImean
WshelfdustCaliforniaX
XX
NW Africa
XXPeruX
XX
Benguela
X
X
X
X
X
What explains the high N-ratios?
Based on correlations w/ N-ratio, mean value in high N-ratios situations, difference in high vs. low N-ratio situations
Iron regulation off NW Africa?
No iron regulation off Peru?
What about
Benguela
?
Physical export
Light
Iron
T
box
EKE
Ek
neg
PAR
MLD
I
mean
W
shelf
dust
California
NW
Africa
Peru
BenguelaSlide16
3. Correlation analysis and PP regulation
Spatial correlations with PP
Seasonal cycles
PP
N-supply
W
shelf
/ dust
lighttemperatureTbox
Example: CaliforniaWinter: nitrate, light, temperature (Kudela and Dugdale, 2000)Spring: upwelling resumes, physical export
(Bograd and Mantyla, 2005; Gruber et al., 2011)Late summer: iron regulation (Johnson et al., 2001; Elrod et al., 2008)
From N-ratio analysis: high N-ratios =
physical exportSlide17
3. Correlation analysis and PP regulation
Spatial correlations with PP
Seasonal cycles
Benguela
From N-ratio analysis:
high N-ratios =
light
/
export / iron
NW Africa
From N-ratio analysis: high N-ratios = iron
High N-ratio narrow shelfSlide18
3. PP regulation
high N-ratios
Nitrate supply
Iron supply
Physical export
LightSlide19
N-ratio as a tool to monitor nitrate regulation but also ecosystem efficiency
PP regulation highly variable in space and time, concept of co-limitations
Need for validation of iron limitation (NW Africa /
Benguela
)
Conclusions
Nitrate supply
Iron supply
Physical export
LightCalifornia
PeruNW AfricaBenguelaaveraged N-ratio0.730.820.520.63