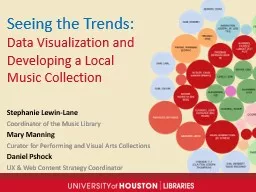
PPT-Seeing the Trends: Data Visualization and Developing a Local Music Collection
Author : myesha-ticknor | Published Date : 2018-11-08
Stephanie LewinLane Coordinator of the Music Library Mary Manning Curator for Performing and Visual Arts Collections Daniel Pshock UX amp Web Content Strategy
Presentation Embed Code
Download Presentation
Download Presentation The PPT/PDF document "Seeing the Trends: Data Visualization a..." is the property of its rightful owner. Permission is granted to download and print the materials on this website for personal, non-commercial use only, and to display it on your personal computer provided you do not modify the materials and that you retain all copyright notices contained in the materials. By downloading content from our website, you accept the terms of this agreement.
Seeing the Trends: Data Visualization and Developing a Local Music Collection: Transcript
Stephanie LewinLane Coordinator of the Music Library Mary Manning Curator for Performing and Visual Arts Collections Daniel Pshock UX amp Web Content Strategy Coordinator Outline Significance of Houston Music. And people everywhere in the world will relate to that Lyman MacInnis Managing Director Balmur Management Ltd Appropriately enough my 64257rst encounter with country music was while driving with my father Navigating highways and back roads en route Zhonghua. . Qu. and . Ovidiu. . Daescu. December. . 24, 2009. University of Texas at Dallas. Introduction. Assisting Visualization System. Implementation. . Examples. Conclusion. Outline. Introduction. Gina Cheung. Beth-Ellen Pennell. North American DDI Conference. April 1-2, 2014. Survey Life Cycle. Questionnaire design . Questionnaire & SMS programming . Interviewer . training. Field work. Data processing; coding . Nicholas Del . Rio. University of Texas at El Paso Computer Science. Workshop Objectives. U. nderstand . notion . and purpose of visualization . queries. Understand why writing queries may be easier that writing visualization programs. Yingcai Xiao. Computation with and without Visual Assistance. 67 x 89 = ? . Visualized Data Analysis. 67. x 89. ---------. 603. + 536. ---------. 5963. . Data Visualization and Developing a Local Music Collection . Stephanie Lewin-Lane. . Coordinator of the Music Library. Mary Manning. . Curator for Performing and Visual Arts Collections. Daniel Pshock. David Granholm. , Senior Director PM . Matt Milella, VP Engineering. Oracle Analytics. October 4, 2017. 2. 3. Oracle Analytic Apps Portfolio. OTBI. DV. Content. Packs. Oracle Analytic Cloud (OAC). Next-Gen. iPhone. Capstone Team#5. Fall 2009. Table of Contents. Topic. Slide Number. Team information. ………………………………………………3. Instructor/Mentors Information. ………………………………………………4. La gamme de thé MORPHEE vise toute générations recherchant le sommeil paisible tant désiré et non procuré par tout types de médicaments. Essentiellement composé de feuille de morphine, ce thé vous assurera d’un rétablissement digne d’un voyage sur . ParaViewWeb. Web3D – . Paris 2011. Julien. . Jomier. , . Kitware. . julien.jomier@kitware.com. Motivation. Acquiring Data (2). Tissue rotates. Knife advances. This tissue ribbon is collected by a submerged conveyor belt. 4 MUVA a Flexible Visualization Architecture for Multiple Client Platforms1 Introduction Information visualization is a growing area of interest and research As opposed to traditional data repre It’s no secret that this world we live in can be pretty stressful sometimes. If you find yourself feeling out-of-sorts, pick up a book.According to a recent study, reading can significantly reduce stress levels. In as little as six minutes, you can reduce your stress levels by 68%. Cherdyntsev E.S.. We have now covered the start and the end of the visualization . pipeline, . namely getting data into the computer, and, on the . human side. , how perception and cognition help us interpret images. . Jamal . Alsakran. . Kent . State University, . Ohio. Ye Zhao . Kent . State University, Ohio . . Yang . Chen . University . of North Carolina -.
Download Document
Here is the link to download the presentation.
"Seeing the Trends: Data Visualization and Developing a Local Music Collection"The content belongs to its owner. You may download and print it for personal use, without modification, and keep all copyright notices. By downloading, you agree to these terms.
Related Documents