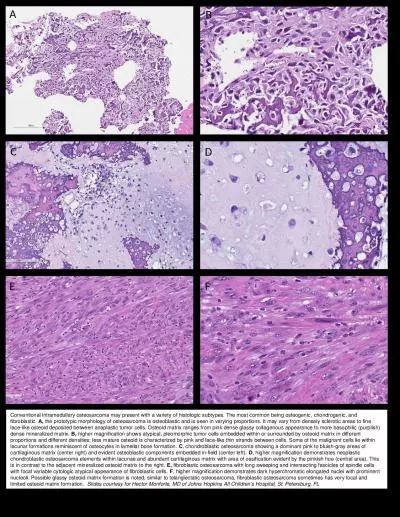
Ovidiu Daescu Colaborators Bogdan Armaselu and Harish Babu Arunachalam University of Texas at Dallas JohnPaul Bach Kevin Cederberg Dinesh Rakheja Anita Sengupta ID: 509095
Download Presentation The PPT/PDF document "Whole Slide Image Stitching for Osteosar..." is the property of its rightful owner. Permission is granted to download and print the materials on this web site for personal, non-commercial use only, and to display it on your personal computer provided you do not modify the materials and that you retain all copyright notices contained in the materials. By downloading content from our website, you accept the terms of this agreement.
Slide1
Whole Slide Image Stitching for Osteosarcoma detection
Ovidiu Daescu
Colaborators
:
Bogdan
Armaselu
and
Harish
Babu
Arunachalam
University of Texas at
Dallas
John-Paul Bach, Kevin Cederberg, Dinesh
Rakheja
, Anita
Sengupta
, Stephen
Skapek
and
Patrick
Leavey
UT SouthwesternSlide2
Topics of presentation
Digital pathologyWhole Slide images (WSI)Image Stitching for WSIImage Stitching algorithms
Problem Statement
Architecture
The algorithm – Quad detection
Seamless image stitching
R
esults
Future workSlide3
Digital Pathology
Digital pathology is the organization, management and analysis of pathology information through digital images
Images are large-resolution
Processing is computationally complex due to size of image
Image courtesy:
Kothari
S et al.Slide4
Whole Slide Images (WSI)
High magnification images of cells and tissuesUsually 20x or 40x times magnificationEach image is made of number of tiled imagesThere are very few open vendor image formats
Uses
Education, Research, Tele-pathology, Tele-consultationSlide5
Image Stitching for WSI
Why is image stitching important ? Helps in pathological image reconstructionGives a holistic view of slides under studyHelps to understand the bigger picture of the specimen
Helps to perform analysis on the gross image cumulatively.Slide6
Image stitching algorithms – till now
Require fixed dimensions of imagesUse color gradients, average pixel methods for matching (Ma et al.)Certain algorithms work with only fixed orientations (Gallagher et al.)
Template image and image slides have same color gradients
Very susceptible to noise in image slidesSlide7
Problem Statement
Given: A template image of an unprocessed bone, a set of WSIsTo do:
To reconstruct an image of WSIs using the template image
Helpful parameters:
The images are JPEG, image names belong to a specific naming order
Typical Challenges
Template image and WSIs have different color gradients
Presence of artifacts
Orientation issuesPresence of noise in the form of inks, blurry imagesPresence of large white marginsDimensions of WSIs are not consistentSlide8
ArchitectureSlide9
The Algorithm
There are two phases for the algorithmQuad generation <Input: gross image>
The gross image is run through Canny edge detector and grid lines are identified
The output image is then axis aligned using Hough transform and quads are generated
Seamless image stitching
<Input: WSIs, Quad file >
The WSIs are then subjected to pairwise correlation using quads value
Stitching is performed based on pairwise gradient matching and canvas rendering through Coordinate mapsSlide10
Quad generation (1/3)
Input: Gross image containing dark lines representing slicing boundariesOutput: Quad data file
The quads data are generated as follows
The gross image is run through Canny edge detector to generate the grid lines.
A Gaussian filter of (kernel width 5) is used to remove crooked/ skinny lines that are of less significance.
A color gradient of 60 is used to remove false positives and gray out colors less than threshold valueSlide11
Quad generation– cont’d(2/3)…
This image is the input for the Hough transform, to estimate the angle of tilt of gross image with axis.
H( r,
θ
) is the
number of points on a line L( r,
θ) such that ‘r’ is the length of the line L from the origin OThe most common angle of the lines in image is estimated as
θ*The gross image is rotated by an angle of θ* so that the image is axis alignedPost processing Steps
Edge detection algorithms detect bone margins as edges and hence lines greater than threshold L = 2*sqrt(WxH) are selected.Lines with distance greater than L/2 =
sqrt(WxH) pixels are discarded to remove false positives.Slide12
Quad generation - cont’d (3/3)…
Computing quadsAll the grid lines computed in previous step are sorted, horizontal lines by X coordinates and vertical lines by Y-coordinates.
An intersection of the horizontal and vertical lines yield bounding boxes of X,Y, Width, Height
They are then written into
a quad file as <WSI name, X, Y, width, height
>
The WSIs are numbered in lexicographical order from left to right and their position in gross images are computed in non-decreasing orderSlide13
Seamless Image Stitching
Input: WSI files and Quad data fileOutput: Seamlessly stitched final imageThe image stitching is performed as follows
Image rotation based on pairwise correlation
Seamless image stitching based on pairwise gradient matching
Image rendering through coordinate mapping and transformation pointSlide14
Seamless image stitching
Image rotation based on pairwise correlationTwo images
Ri
and
Rj
are rotated to find the best match.
The following pairwise calculation is used on each pixel of
Ri and
Rj within window ‘w’Slide15
Seamless image stitching – cont’d (2/3)
For each of the WSIs in the dataset, the best pairwise gradient Gi
and
Gj
is found
The best matching index for each row is computed for each row and each column
Image rendering through coordinate mapping and transformation
point
Based on the quads data, a coordinate map is populated
Each image is rendered by iterating the coordinate map Slide16
Seamless image stitching – cont’d (3/3)
The images might suffer from noise and blurred regions which might affect image stitching. In case the gradient calculation is same for two images, the image orientation might be wrong
Such incorrect image rendering is corrected manually by calculating transformation points from quad record, QR
Coordinates are calculated based on the following condition
The transformation point of rotation is retrieved as followsSlide17
Some results
All data were JPEG images, taken from UTSW Osteosarcoma patient database. All images are from positive cancer samples.We have 98
% accuracy on the datasets we used.
Results are as follows
Gross image
WSIs
Seamless stitching in Java application
Seamless stitching in HTML/JS application
O/PSlide18
Future work
Extend the application for SVS and Big-Tiff imagesPerform image analysis on SVS images.pixel-based, object-based and semantics-based segmentationsBuild knowledge base and learn Cancer Regions of Interest(ROIs) using Machine Learning techniques: predictive modelling, clustering
Build a sliding window application for selective analysisSlide19
Thank you!
Questions welcome