/
Global Distribution of Crustal Material Global Distribution of Crustal Material

Global Distribution of Crustal Material - PowerPoint Presentation

natalia-silvester
natalia-silvester . @natalia-silvester
Follow
400 views
Uploaded On 2016-03-12

Global Distribution of Crustal Material - PPT Presentation

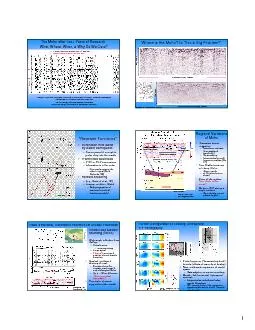
Inferred by Seismology Nozomu Takeuchi ERI Univ of Tokyo Importance of Directional Measurements from geophysicists point of view 2 Improvements of Neutrino Flux Modeling ID: 253180

crust data mantle broadband data crust broadband mantle models crustal crusts period oceanic short structures depth based velocity neutrino

Share:

Link:

Embed:

Download Presentation from below link

Download Presentation The PPT/PDF document "Global Distribution of Crustal Material" is the property of its rightful owner. Permission is granted to download and print the materials on this web site for personal, non-commercial use only, and to display it on your personal computer provided you do not modify the materials and that you retain all copyright notices contained in the materials. By downloading content from our website, you accept the terms of this agreement.


Presentation Transcript

Slide1

Global Distribution of Crustal MaterialInferred by Seismology

Nozomu

Takeuchi(ERI, Univ of Tokyo)

Importance of Directional Measurements from geophysicists’ point of view

(2) Improvements of Neutrino Flux Modeling

in the seismological aspectsSlide2

Parameters Required for Geo-neutrino Simulation = Parameters Resolved by Geo-neutrino Observation

Earth’s Composition

Earth’s Structure(c

ompositions of crust & mantle)(distributions of crustal materials)

Approach for Retrieving Earth’s Structure

“Geophysical Decomposition” as a tool for interpretation

of the observed data

Importance of directional measurementsSlide3

Prediction by High Pressure Experiments

Ringwood &

Irifune (1988)

Density measurements in theupper mantle conditions

Oceanic crusts can be

trapped around the 660, but

finally entrained into the lower mantle.

Fate of the Oceanic Crusts (1)Slide4

Suggestion by

Mantle Convection

Simulation

Nakagawa &

Tackley

(2005)

Oceanic crusts can

sink into the lowermost mantle

, and

accumulate at the bottom of upwelling regions.

Fate of the Oceanic Crusts (2)Slide5

Fate of the Oceanic Crusts (3)

Indirect Evidence by Seismic Tomography

S velocity

Bulk-sound velocity

Masters et al. (2000)

Chemical heterogeneities are suggested

at the bottom of upwelling regions.

p

ossible accumulation of

o

ceanic crustsSlide6

Example Classification of Geo-Neutrino Source

c

ontinental

crustoceanic crust

(1) Surface Crust

(2) Ambient Mantle

(3) Crust in and around

Subducting

Slabs

(4) Crust at the bottom of

upwelling regions (LLSVPs)

detector

Can

we decompose the observed flux into the above four

components

?

We can utilize differences in incoming directions (directivities).Slide7


n

eutrino flux

a

t the detector (

r

’)

decay rate

=

x

i

ntensity factor determined by

s

ource distributions


Formulation by

Enomoto

et al. (2007)

Expected Directivity by the Surface Crust (1)

Intensity

F

actor

from j-

th

Directional

B

in


VSlide8

Expected Directivity by the Surface Crust (2)

N

S

E

W

distance from the center

b

ottoming radius

azimuth

d

irection from the center

p

ainted color

 Slide9

Difference in Expected Directivities

+2%

+1%

N

S

E

W

240-290 km depth

550-630 km depth

Obayashi et al. (2009)Slide10

“Geophysical Decomposition” As an Interpretation Tool


: incident angle

: incident azimuth

Coefficients can be determined by solving an inverse problem.


r

eference model :


larger mass fraction of depleted mantle?

anomalies in

b

ulk composition of the Earth?


e

ntrainments of continental crust?

m

egalith on the 660?


e

nriched elements in the lowermost mantle?Slide11

(short period data)

(broadband data)

Appropriate Choice of the Tomography Models

Fukao

et al. (2001)Slide12

broadband sensor

short period (high sensitivity) sensor

Type of Seismic DataSlide13

0.01-0.05 Hz

0.05-0.1 Hz

0.1-0.5 Hz

0.5-1 Hz1-5 Hz

5-10 Hz

Usefulness of Broadband Waveforms

a

ll frequencies

b

roadband data

Short period

dataSlide14

Comparison of Station Coverage

200 stations

20,000 stations

s

hort period data

Broadband

data

homogeneous

heterogeneousSlide15

500 km depth

Masters et al. (2000)

Data Type and Obtained Tomography Models

Bijwaard

et al. (1998)

500 km depth

b

roadband data

Short period

data

Models Obtained

by Using

:

o

verall

s

tructures, structures beneath oceans

broadband data

s

hort period data

:

detailed structures in

subduction

zonesSlide16

Difficulties to Obtain Data-Based Crustal Models

Too thin to resolve the global map.

S

ensitive frequency band is very “noisy”.

Recent Progresses in Seismology

Dense broadband arrays with sufficient resolving power.

Use of “noise” to reveal crustal structures.

Current global model (CRUST 2.0) is not fully data-based.Slide17

Importance of Data Based Science

Kodaira

et al. (2010)

Crust 2.0

Crustal Structure by Exploration Data

Improvements in Crust Models (1)

(short period data)Slide18

Improvements in Crust Models (1)

Zheng

et al. (2011)

Dense broadband arrays are beginning

to reveal crustal maps

Mapping by Broadband DataSlide19

Improvements in Crust Models (2)

Future Challenge

Broadband networks installed by ERI

Use of broadband OBS data

Data based crustal map in wide areas around JapanSlide20

OBS observations in 2003-2010

(short period data)

Validation of our crustal map

Further refinements in the resolved regionsSlide21

Challenge to Detection of Crusts in the Mantle (1)

Station 1

Station 2

Station 3

c

oherent

phase

i

nc

oherent

phase

(scattered waves)

c

oherent

p

hase: sensitive to larger-scale structures

i

nc

oherent phase: sensitive to smaller-scale structures

Conventional

tomography

This StudySlide22

Challenge to Detection of Crusts in the Mantle (2)

Required Resolution

Current Resolution

Use of incoherent phases may fill

the gap

between supply and demand.Slide23

Summary of The Talk

“Geophysical Decomposition”

Importance of Directional MeasurementsData Based Seismological Earth Models

Use of “noise” in our broadband OBS

Use of “incoherence” in seismic waveformsSlide24
Slide25
Slide26

Comparison of 3-D Seismic Velocity Models

Predominance of larger

lateral scale length of

heterogeneities.

S velocity structure at 2800 km depth

Low velocity province

beneath the Pacific and

Africa.