PPT-They Spend More On Products & Services
Author : natalia-silvester | Published Date : 2015-09-21
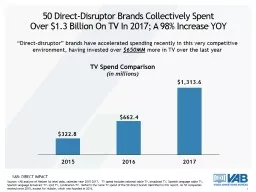
Source MRI Doublebase 2013 Cable Viewer Index Broadcast Viewer Index Automotive Total Amount Spent on Most Recent PurchaseLease 30000 109 61 Total Amount Spent
Presentation Embed Code
Download Presentation
Download Presentation The PPT/PDF document "They Spend More On Products & Servic..." is the property of its rightful owner. Permission is granted to download and print the materials on this website for personal, non-commercial use only, and to display it on your personal computer provided you do not modify the materials and that you retain all copyright notices contained in the materials. By downloading content from our website, you accept the terms of this agreement.
They Spend More On Products & Services: Transcript
Download Rules Of Document
"They Spend More On Products & Services"The content belongs to its owner. You may download and print it for personal use, without modification, and keep all copyright notices. By downloading, you agree to these terms.
Related Documents