/
Validation of  genomic predictions and genomic reliability Validation of  genomic predictions and genomic reliability

Validation of genomic predictions and genomic reliability - PowerPoint Presentation

natalia-silvester
natalia-silvester . @natalia-silvester
Follow
348 views
Uploaded On 2019-11-29

Validation of genomic predictions and genomic reliability - PPT Presentation

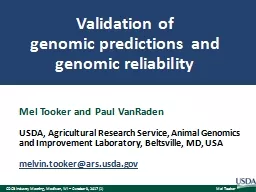
Validation of genomic predictions and genomic reliability Mel Tooker and Paul VanRaden USDA Agricultural Research Service Animal Genomics and Improvement Laboratory Beltsville MD USA melvintookerarsusdagov ID: 768624

grel 2014 gpta 2017 2014 grel 2017 gpta validation rel daughters bulls genomic holstein bull base young average gain

Share:

Link:

Embed:

Download Presentation from below link

Download Presentation The PPT/PDF document "Validation of genomic predictions and g..." is the property of its rightful owner. Permission is granted to download and print the materials on this web site for personal, non-commercial use only, and to display it on your personal computer provided you do not modify the materials and that you retain all copyright notices contained in the materials. By downloading content from our website, you accept the terms of this agreement.


Presentation Transcript

Validation of genomic predictions and genomic reliability Mel Tooker and Paul VanRaden USDA, Agricultural Research Service, Animal Genomics and Improvement Laboratory, Beltsville, MD, USA melvin.tooker@ars.usda.gov

TopicsInterbull validation of genomic predictions (GPTAs) Predict later deregressed GPTA from earlier GPTA, weighted by later genomic reliability (GREL) Simpler validation of GPTA Predict later GPTA from earlier GPTA Simple validation of GREL Estimate earlier GREL from later GREL, genetic standard deviation (SD) , and SD of change (later GPTA – earlier GPTA) Gains in reliability (REL) from more frequent updates

InterbullInternational Bull Evaluation Service (Uppsala, Sweden) Permanent subcommittee of the International Committee for Animal Recording (ICAR) Responsible for: Documenting evaluation systems Forming technical workgroups Multiple-trait, across-country evaluation (MACE) Selling domestic semen in many other countries requires that methods used to calculate PTA and GPTA are validated by Interbull every 2 years

Trend validation – ideal net merit (NM$)

Trend validation – NM$ for proven bulls

Trend validation – NM$ for all bulls

Holstein GPTA validation (preliminary) Trait Slope* Intercept* Milk 0.98 – 113 Fat 0.92 – 2.4 Protein 0.88 –1.7Somatic cell score1.06 0.3Daughter pregnancy rate1.04 0.1Heifer conception rate1.04 –0.3Final score1.03 –0.2Strength1.03 0.1 *After base change adjustment

Simple GPTA validation results Trait R 2 (%) Intercept* Slope* Net merit 82 –12 1.00 Milk 81 –131 1.01Fat81 –30.95Protein80 –30.94Productive life83 –0.31.07Somatic cell score77 –0.041.01Daughter pregnancy rate 79 0.1 1.06Cow conception rate79 0.41.08Heifer conception rate68 0.40.97 *After base change adjustment 3,984 young Holstein bulls from Aug. 2014 with >100 daughters in Aug. 2017

NM$ Progeny (2017) Bull 2017 2014* PA 2014* Daughters AI sons Robust 744 615 339 2,319 102 Erdman 704 593 304 5,433 10 Twist 551 5672492,3024AltaGreatest6445553041,36510AltaFairway5715503762,4600Diesel4575223021,2420Yano46651832811,07414Facebook4405043205,76614Awesome4925043227,3340Manifold55850126058,0303Top 10 average5635433119,73316 *Base-adjusted values Top proven Holstein bulls (August 2014) Now with >1,000 daughters

NM$ Progeny (2017) Bull 2017 2014* PA 2014* Daughters AI sons Troy 635 747 494 1,209 58 Rogers 688 708 533 1,338 17 Cabriolet 866 6805076,35410Ponder7266605331,2956Emerald5126565001,1986Bombero6936485381,24535Halogen3236424751,92283Jayden6266424642,9273Supersire85564251016,627260Donatello7556395614,74318Top 10 average6686665113,88650*Base-adjusted valuesTop young Holstein bulls (August 2014) Now with >1,000 daughters

NM$ Progeny (2017) Bull 2017 2014* PA 2014* Daughters AI sons Volcano 433 515 313 4,167 29 Magnum 501 497 218 5,985 10 Link 427 4502131,7603Daybreak5104102819355Hickey4294052922664Bindy3954041536190Arhil3464021491060Zimpel4083961901000Victory3513852951,5222Memo158383–642430Top 10 average3964252041,5705*Base-adjusted values Top proven Jersey bulls (August 2014) Now with >100 daughters

NM$ Progeny (2017) Bull 2017 2014* PA 2014* Daughters AI sons Harris 654 567 386 2,113 59 Mackenzie 525 536 313 383 8 Machete 421 5353792,2838Formidable4245304056426Hector3935283761381Walter5615223892893Revolution4575163472152Marlo68450842040719Pilgrim5594862986004Chili51448633598417Top 10 average51952236580513*Base-adjusted valuesTop young Jersey bulls (August 2014)Now with >100 daughters

Data for validating GRELPublished GPTAs April 2014 (GREL 2014 ) April 2017 (GREL 2017 ) SD of difference in GPTAs REML estimates of SD of true transmitting ability (TA) from Interbull MACE

Example GREL validation (Holstein protein) Average published GREL 2014 was 0.76 GREL 2017 was 0.95 SD of change was 8.4 REML TA SD was 17.5 Observed GREL 2014 for protein calculated as: GREL 2014 = 0.95 – 8.42/17.52 = 0.72

Observed vs. published GREL (2014) Jersey Holstein Trait* Obs Pub Diff Obs Pub Diff Milk 73 68 +5 7276–4Fat72 68 +4 7476–2Protein7168+37276 –4 PL 47 55 -86570–5SCS6462+27773+4DPR6352+116968+1NM$6864+46873–5Average6562+37173–2*PL = productive life; SCS = somatic cell score; DPR = daughter pregnancy rate

Average REL for NM$ by age

Phenotypic update frequencySuppose REL increases steadily from REL 1 to REL 2 across a year Gain in REL from n updates per year ( REL n ) instead of 1 annual update should average: Example: Suppose average bull REL increases from 75% (REL1) to 91% (REL2) when 4 years old (no daughters → many daughters) Minimum gain is 0% with an annual update because bulls would stay at 75% for the whole yearMaximum gain is 8% with instant updating; bulls would average (75 + 91)/2 = 83% during that year

Phenotypic update frequency (continued)

REL gains by update frequency Frequency Updates Young Proven REL (%) Marginal gain REL (%) Marginal gain Annual 1 73.10 0.00 75.00 0.006 months273.70 0.60 79.00 4.004 months373.900.2080.30 1.303 months 4 74.00 0.10 81.000.702 months674.100.1081.600.60Monthly1274.200.1082.300.70Weekly5274.280.0882.800.50Daily36574.290.0182.970.17Instant∞74.300.0183.000.03

ConclusionsSimpler validation of GPTA is easier to compute and explain, but not quite as independent New procedure developed to validate GREL GPTA properties are very close to expected GRELs were slightly too high (2%) for Holsteins, slightly too low (3%) for Jerseys Recent GPTAs (young and old) may all be too low (genetic trend is underestimated) Genetic progress is fast!

AcknowledgementsInterbull Working Group on Genomic Reliability (Zengting Liu, Paul VanRaden, Martin Lidauer , Mario Calus, Vincent Ducrocq , Haifa Benhajali, and Hossein Jorjani) Council on Dairy Cattle Breeding for DHI data from dairy farmers USDA-ARS project 1265-31000-101-00, “Improving Genetic Predictions in Dairy Animals Using Phenotypic and Genomic Information”