/
Vectors and Scalars Vectors and Scalars

Vectors and Scalars - PowerPoint Presentation

natalia-silvester
natalia-silvester . @natalia-silvester
Follow
469 views
Uploaded On 2016-07-08

Vectors and Scalars - PPT Presentation

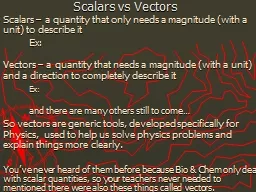
Objectives Distinguish between vector and scalar quantities Add vectors graphically Scalar a quantity that can be completely described by a number called its magnitude and a unit Ex length temperature and volume ID: 395547

displacement vector vectors draw vector displacement draw vectors scale resultant due magnitude length south west east north direction find

Share:

Link:

Embed:

Download Presentation from below link

Download Presentation The PPT/PDF document "Vectors and Scalars" is the property of its rightful owner. Permission is granted to download and print the materials on this web site for personal, non-commercial use only, and to display it on your personal computer provided you do not modify the materials and that you retain all copyright notices contained in the materials. By downloading content from our website, you accept the terms of this agreement.


Presentation Transcript

Slide1

Vectors and Scalars

Objectives

:

Distinguish between vector and scalar quantities

Add vectors graphicallySlide2

Scalar

– a quantity that can be completely described by a number (called its magnitude) and a unit.

Ex: length, temperature, and volume

Vector

– a quantity that requires both magnitude (size) and direction.

Displacement, force, and velocitySlide3

Displacement

– the net change in position of an object; or the direct

distance

and

direction

it moves.

Examples: 15 mi NE, 10 meters upward

It does not contain any information about the path an objects moves.

How can an object change position but have a displacement of zero? Give an example.Slide4

Vector quantities can be represented by either letter symbols with arrows above them or with bold letters.

d

or

dScalars are simply italicized.Slide5

Vectors are drawn as arrows

in the correct direction

and the magnitude is indicated by the length.

An appropriate scale is selected, e.g. 1.0 cm = 25 mi.

Draw vectors for the following displacements using the scale above:125 mi west50 mi at 45o

east of northSlide6

Using a scale of 1.0 cm = 50 km, draw the displacement vector 275 km at 45

o

north of west.

Using a scale of ¼ in = 20 mi, draw the displacement vector 150 mi at 22

o east of south.Slide7

Graphical Addition of Vectors

Any given displacement can be the result of many different combinations of displacements.

For example, there is more than one way to get to the cafeteria.

Resultant vector

– the sum of a set of vectors.Slide8

To solve a vector addition problem such as one for displacement.

Choose a suitable scale and calculate the scale length of each vector.

Draw a north-south reference line. Graph paper can be used.

Using a ruler and protractor, draw the first vector and then draw the

other vectors so that the initial end of each vector is placed at the terminal end of the previous vector.

Draw the sum, or the resultant vector, from the initial end of the first vector to the terminal end of the last vector.

Measure the length of the resultant and use the scale to find the magnitude of the vector. Use a protractor to measure the angle of the resultant.Slide9

Find the resultant displacement of an airplane that flies 20 mi due east, then 30 mi due north, then 10 mi at 60

o

west of south.Slide10

Find the resultant of the displacements 150 km due west, then 200 km due east, and then 125 km due south.