/
Introduction  Meaning of Business Economics Introduction  Meaning of Business Economics

Introduction Meaning of Business Economics - PowerPoint Presentation

oconnor
oconnor . @oconnor
Follow
66 views
Uploaded On 2023-07-28

Introduction Meaning of Business Economics - PPT Presentation

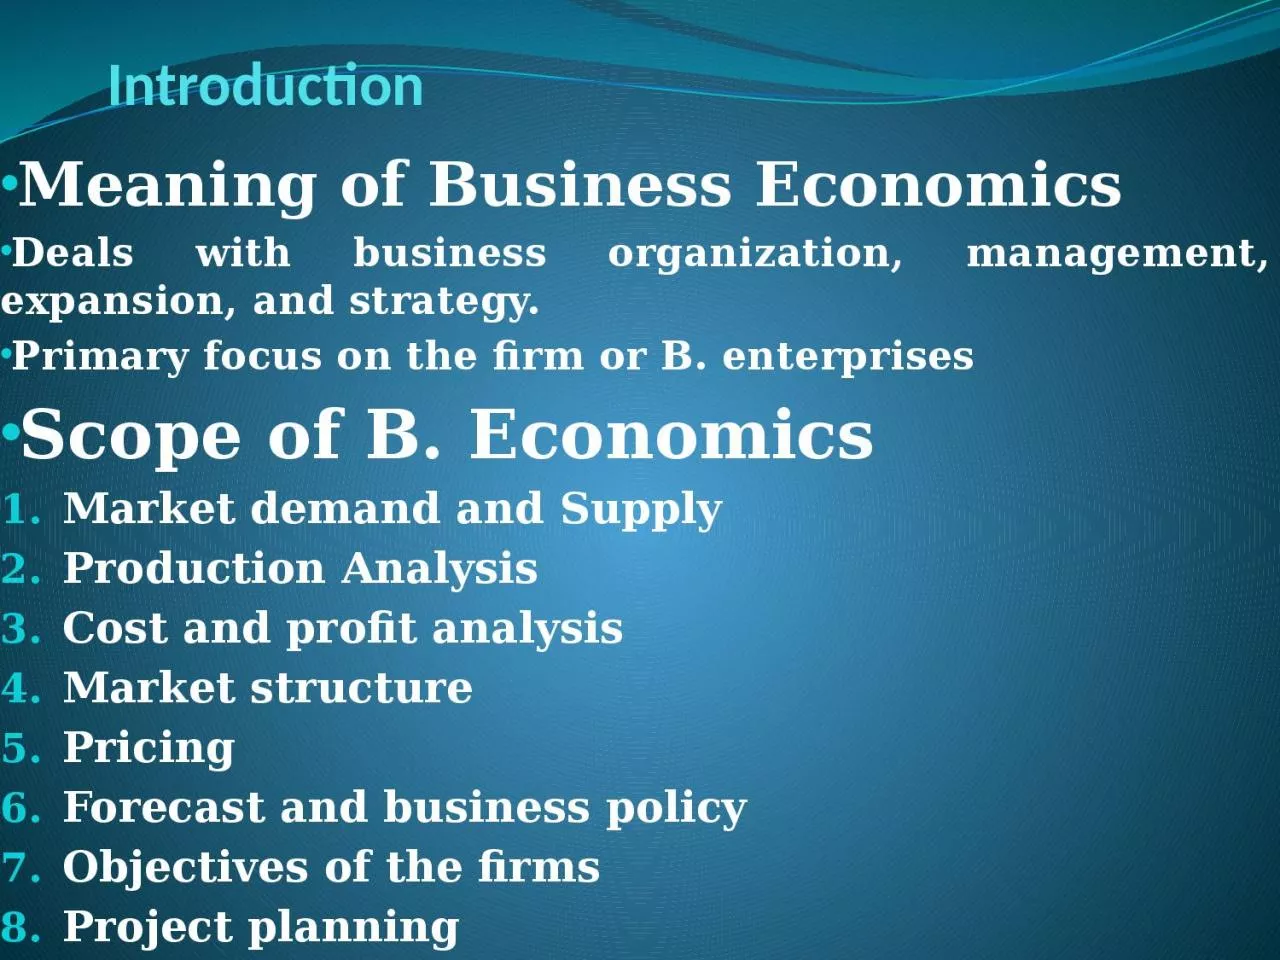
Deals with business organization management expansion and strategy Primary focus on the firm or B enterprises Scope of B Economics Market demand and Supply Production Analysis Cost and profit analysis ID: 1012635

price demand qsx marginal demand price marginal qsx qdx quantity commodity 100 supply average market business increase demanded increasing

Share:

Link:

Embed:

Download Presentation from below link

Download Presentation The PPT/PDF document "Introduction Meaning of Business Econom..." is the property of its rightful owner. Permission is granted to download and print the materials on this web site for personal, non-commercial use only, and to display it on your personal computer provided you do not modify the materials and that you retain all copyright notices contained in the materials. By downloading content from our website, you accept the terms of this agreement.


Presentation Transcript

1. Introduction Meaning of Business EconomicsDeals with business organization, management, expansion, and strategy. Primary focus on the firm or B. enterprises Scope of B. EconomicsMarket demand and Supply Production AnalysisCost and profit analysis Market structurePricing Forecast and business policyObjectives of the firmsProject planning

2. Basic concepts for B. Economics Opportunity cost Marginalizm Marginal means extra or addition --- ΔResources have to use at the marginUse of recourses in optimal manner business take decision at the margin Increase or decrease the output, capacity market expansion international business, change in workforceMC = ΔTC/ ΔQMR = ΔTR / ΔQ

3. Incrementalism Relations between Total and marginalTotal is increasing --------marginal must be positiveTotal is declining -------- Marginal is negative Total increasing at increasing rate ----- marginal value will increase Total value increasing at diminishing / decreasing rate -------- marginal value will fall Marginal and Average Marginal > Average ------- average will riseMarginal = Average --------- average will constant Marginal < Average ------- average will fall down

4. Concepts/ tools for Economic analysis Variables : is a magnitude of interest that can be defined and measuredEx. Price, Profit, Revenue, Cost, Investment, Demand,Supply ………… 2. Functions: f It shows the relationship between to variables D = f ( P) C = f (Y)S = f (P)……….

5. EquationsAn equation specifies the relationship between the dependant and independent variablesEquations refers to a statement of equality of two expressionD=f (P) Symbol  = shows equality of  two expressions Demand and PriceGraphsGraph is a diagram showing how two or more sets of data or variables are related to one another SlopesThe slope refers to change in one variable due to change in other variable at a particular rate. Demand Demand is defined as the quantity of a commodity which a customer is willing to buy at a particular price in a particular market at a particular time. Demand means desire backed by ability to buy and willingness to pay for a commodity.

6. Market Demand SchedulePrice per unit DemandADemandBDemandCMarket Demand01008050230190704020028060301703705020140460401011055030080

7. Market Supply SchedulePrice per unit Supply ASupply BSupply CMarket Supply 05030080160401011027050201403806030170490704020051008050230

8. SupplpSSupplyPrice

9. Market equilibrium Demand = SupplyESD3.5o65

10. Equilibrium Price: is that price of a commodity at which the demand and supply of a commodity are equal.Qdx = Qsx ……….. 1Qdx = quantity demanded of x commodity Qsx = quantity supplied of x commodity Qdx = f(P)Qdx = a – bpx …… 2 …… demand function Qdx = 100 – 10Px Qsx = f(P)Qsx = - c + dpx ……. 3 …….. Supply functionQsx = - 40 + 30 Px a, b, c, d parameters P price X commodity

11. Qdx = 100 – 10Px Qsx = - 40 + 30 Px Qdx = Qsx 100 – 10Px = - 40 + 30 Px - 10 Px -30Px = -40 -100 by multiplying -1 10 Px + 30 Px = 40+ 100 40Px = 140 Px = 140/40 Px = 3.5Qdx = 100 – 10Px Qdx =100 – 10 x 3.5 = 65Qsx = - 40 + 30 Px Qsx = -40 + 30x3.5 = 65

12. If Qdx = 200 – 5Px , Qsx = - 250 + 10 Px then find Equilibrium Price Quantity demanded Quantity suppliedQdx = 40– 0.1PxQsx = - 20 + 0.2Px

13. Changes in demand Shifts in demand Increase in demandDecrease in demandPrice remaining the same, if other things increases, demand increase(Increase in demand_ if other things falls, demand will decrease (decrease in demand) DPriceoDemandPD1D1D2D0

14. Changes in demand Movement along the demand curveExtensionContraction Other things remaining the same, if price falls, quantity demanded will rise (Extension), if price rises, quantity demanded will fall (Contraction)ADPriceoDemandBP2P1D2D1

15. Determinants of demand D = f (P, Y, Po,………..)PriceIncomePopulation, Taste, Habit and fashionGovernment Policy – tax, expenditureAdvertisementChange Price of related goodsFuture Expectation of rise or fall in priceDistribution of income - MPCChange in climatic conditions Traditions / Culture/ Religion/ Social factorspolitical and social factors Interest rateTechnology and practices

16. Demand FunctionA demand function expresses the relationship between the quantity demanded of a commodity and its determinants.Qx = f (Px, Y, Ps, Pc, T, N, E, A, I, S……..)Qx = a – bPx + cY+dPs…….Demand Function and PriceQx = f (P)Qx= a – b PxQx = 200 – 10 Px 200 – 10 x 4Px = 1, 4, 8, 10, 15a- 200b -100DemandPricePxQx119041608120101001520