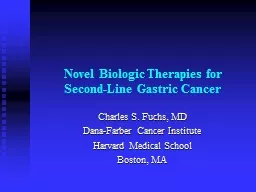
SecondLine Gastric Cancer Charles S Fuchs MD DanaFarber Cancer Institute Harvard Medical School Boston MA SecondLine Therapy in Gastric Cancer No approved 2 nd line chemotherapy ID: 629424
Download Presentation The PPT/PDF document "Novel Biologic Therapies for" is the property of its rightful owner. Permission is granted to download and print the materials on this web site for personal, non-commercial use only, and to display it on your personal computer provided you do not modify the materials and that you retain all copyright notices contained in the materials. By downloading content from our website, you accept the terms of this agreement.
Slide1
Novel Biologic Therapies for Second-Line Gastric Cancer
Charles S. Fuchs, MD
Dana-Farber Cancer Institute
Harvard Medical School
Boston, MASlide2
Second-Line Therapy in Gastric Cancer
No
approved
2
nd
-line chemotherapy
20-40% patients receiving 1
st
-line therapy receive 2
nd
-
line
Taxanes
and
irinotecan
most commonly used 2
nd
-line therapySlide3
Phase II Studies of Taxanes as Second-Line Therapy for Gastric Cancer
Drug
Author
No. of Pts
RR
PFS (mos)
OS (mos)
Docetaxel
Graziano
21
5%
--
3.5
Docetaxel
Giuliani
30
17%
--
6.0
Docetaxel
Jo (S. Korea)
154
14%
2.6
7.2
Paclitaxel
Hironka (Japan)
38
24%
--
5.0
Vinorelbine
Kulke
29
7%
1.9
7.8Slide4
Second-Line Therapy in Gastric Cancer
Historically, few randomized phase III trials compared to BSC
Numerous
phase II trials:
Variability in response to 1
st
-line therapy
Variability in prior 1
st
-line therapy
Publication bias
Small number of patientsSlide5
Second-Line Therapy in Gastric Cancer
625 pts who received 1
st
-line therapy at 3 centers in Italy
28% (175) received 2
nd
-line therapy
RR = 16%
Median OS = 6 months
Predictors of poor survival: ECOG PS 2 Hgb 11.5 g/l CEA > 50 ng/ml >3 to 4 metastatic sites TTP for 1st-line 6 months
Catalano et al. 2008Slide6
Second-Line Therapy in Gastric Cancer
1,080
patients
in three 1
st
-line phase
III
trials
20% received 2
nd line therapy RR for 2nd-line therapy = 13% Median OS = 5.6 monthsIndependent poor prognostic factors:ECOG PS ≥ 2Liver metsPeritoneal metsSerum alkaline phosphatase ≥ 100 U/LChau et al J Clin Oncol 2004Slide7
Chau
et al J Clin Oncol 2004Slide8
Irinotecan vs. Best Supportive Care in
Second-line Gastric Cancer
Thuss-Patience et al. ASCO 2009
Irinotecan
250 mg/m2
q 3weeks
Best Supportive Care
Median
Survival
4.1 mos 2.4
mos
P = 0.02
HR = 0.48 (95% CI, 0.25-0.92)
N
21
19Slide9
Cougar-02: Randomized Trial of Docetaxel vs. BSC in Relapsed Esophagogastric Adenocarcinoma
R
A
N
D
O
M
I
Z
EDocetaxel 75 mg/m2 q 3 weeksBest supportive care
168 patients :
Primary Endpoint:
Overall
SurvivalSlide10
Cougar-02: Randomized Trial of Docetaxel vs. BSC in Relapsed Esophagogastric Adenocarcinoma
Docetaxel
BSC
P value
Response rate
7%
NR
Overall survival
5.2 months
3.6 months0.01Cook et al. ASCO 2013Slide11
Metastasis
Proliferation/Maturation
Survival/Apoptosis
Angiogenesis
MAPK
MEK
Gene transcription
Cell-cycle progression
PI3-K
RAS
RAF
SOS
GRB2
PTEN
AKT
STAT
pY
pY
K
K
pY
EGFR Signal Transduction
M
G1
S
G2Slide12
Ongoing Randomized Trials in Advanced Esophagogastric Adenocarcinoma
R
A
N
D
O
M
I
Z
E730 patientsEOX
EOX
Panitumumab
REAL-3
Trial
R
A
N
D
O
M
I
Z
E
870
patients
Capecitabine
Cisplatin
EXPAND
Trial
Capecitabine
Cisplatin
CetuximabSlide13
PI3K/Akt/mTOR Pathway in Gastric Cancer
The PI3K/Akt/mTOR pathway, a key regulator of cell proliferation, growth, survival
,
metabolism, and angiogenesis, is dysregulated in 50%-60% of gastric cancers
1-3
Everolimus, an oral mTOR inhibitor, showed efficacy in preclinical models of gastric cancer
1,4-6
13
mTOR, mammalian target of rapamycin; PI3K, phosphatidylinositol 3-kinase.
1Xu DZ et al. BMC Cancer. 2010;10:536; 2Lang SA et al. Cancer. 2007;120:1803-10; 3Yu G et al. Clin Cancer Res. 2009;15:1821-29; 4Taguchi F et al. Invest New Drugs. 2011;29:1198-205; 5Cejka D et al. Anticancer Res. 2008;28:3901-08; 6Jaeger-Lansky A et al. Cancer Biol Ther. 2010;9:919-27; 7Doi
T et al.
J Clin Oncol
. 2010;28:1904-1910
.
In a phase 2 study of 53 patients with previously treated advanced gastric cancer, everolimus showed promising efficacy and acceptable tolerability
7Slide14
Phase 3 GRANITE-1 Study Design
14
Everolimus 10 mg PO daily
+ BSC*
(n = 439)
Placebo
PO daily
+
BSC
(n = 217)
SCREEN
Treatment until disease progression or intolerable toxicity
Stratification by region: Asia vs
rest of world
Stratification by number of
lines
of
previous systemic
chemotherapy (1 vs 2
)
Safety
follow-up
:
EOT
+ 28
d
Survival follow-up
:
every 3 mo
RANDOMIZE
(N = 656)
BSC, best supportive care; EOT, end of treatment; PO, orally.
ClinicalTrials.gov identifier:
NCT00879333
.
2
1Slide15
Overall Survival (FAS)
15
Probability of overall survival (%)
100
80
60
40
20
0
0
2
4
6
8
10
12
Time (months)
14
Censoring Times
Everolimus + BSC (n/N = 352/439)
Placebo + BSC (n/N = 180/217)
Kaplan-Meier medians
Everolimus + BSC: 5.39 months
Placebo + BSC: 4.34 months
Hazard ratio: 0.90 (95% CI, 0.75-1.08)
Log-rank
P
value = 0.1244
No. of patients still at risk
Time (months)
Everolimus
Placebo
16
18
20
22
24
0
2
4
6
8
10
12
14
16
18
20
22
24
217
172
1
17
82
60
35
28
16
12
8
4
1
0
439
355
253
195
139
87
52
30
13
6
3
1
0Slide16
Angiogenesis
Tumor growth
VEGF-A
VEGFR2
VEGF-A
VEGFR2
Ligand binding activates VEGFR2 and
p44/p42 MAP kinases
Ramucirumab
No signaling
Inhibit new blood vessel
formation and tumor growth
Ramucirumab
binds to
VEGFR2, blocks VEGF
ligand binding
VEGF binds to
VEGFR2 receptor;
VEGF-C, -D compete
for binding to
VEGFR2
Ramucirumab (IMC-1121B; RAM) is a
recombinant
human IgG1 monoclonal antibody receptor antagonist designed to bind the extracellular domain of VEGF Receptor-2, thereby blocking the binding of VEGF ligands and inhibiting receptor activation.
Role of VEGF Pathway in Tumor Growth
Endothelial cell membrane
VEGF-C
VEGF-D
VEGF-C
VEGF-DSlide17
Ramucirumab 8 mg/kg q2wk
+
BSC (n
= 238)
R
A
N
D
O
MIZE
Placebo q2wk
+
BSC (n
= 117)
S
C
R
E
EN
Treatment
until disease
progression
or
intolerable
toxicity
Tumor assessment, survival, and safety follow-up
N = 355
Multicenter, randomized, double-blind, placebo-controlled, phase 3 trial
Gastric or GEJ adenocarcinoma
Stratification factors: region, weight loss (≥10%
vs. <10% over 3 months),
location of primary tumor (gastric vs. GEJ)
Global:
6 continents, 30
countries,
120 study centers
REGARD Study
Design
2:1
Abbreviations: BSC=best supportive care; GEJ=
gastroesophageal junction
Fuchs et al. Lancet 2013Slide18
Ram
238
154
92
49
17
7
3
0
0
Plcb
117
66
34
20
7
4
2
1
0
No. at Risk
HR (95% CI) = 0.776 (0.603, 0.998)
Log rank P-value (stratified) =
0.0473
Ramucirumab
Placebo
Patients / Events
238
/ 179
117 / 99
Median (mos) (95% CI)
5.2 (4.4, 5.7)
3.8 (2.8, 4.7)
6-month OS
42%
32%
12-month
OS
18%
11%
REGARD:
Overall Survival
Fuchs et al. Lancet 2013Slide19
Tumor Response
Ramucirumab
N=238
Placebo
N=117
P-value
n
(%)
n
(%)
Best Overall Response
Complete response (CR)
1
(0.4)
0
Partial response (PR)
7
(2.9)
3
(2.6)
Stable disease (SD)
108
(45.4)
24
(20.5)
Progressive disease
78
(32.8)
63
(53.8)
Not evaluable / Not assessed
44
(18.5)
27
(23.1)
Response rate: CR + PR
8
(3.4)
3
(2.6)
0.756
Disease control rate: CR + PR + SD
116
(48.7)
27
(23.1)
<0.0001Slide20
Ram
238
213
113
65
61
45
30
18
18
11
5
4
2
1
1
1
1
0
Plcb
117
92
27
11
7
4
2
2
2
2
2
1
1
0
0
0
0
0
No. at Risk
HR (95% CI) = 0.483 (0.376, 0.620)
Log rank P-value (stratified) = ≤
0.0001
Ramucirumab
Placebo
Patients / Events
238
/ 199
117 / 108
Median (mos) (95% CI)
2.1 (1.5, 2.7)
1.3 (1.3, 1.4)
12-week PFS
40%
16%
REGARD:
Progression-free Survival
Fuchs et al. Lancet 2013Slide21
Ramucirumab (N=236)
Placebo (N=115)
TEAEs*
Any
Grade
(%)
Grade ≥3
(%)
Any Grade
(%)
Grade ≥3
(%)
Fatigue
36
6
40
10
Abdominal pain
29
6
28
3
Decreased appetite
24
3
23
3
Vomiting
20
3
25
4
Constipation
15
<1
23
3
Anemia
15
6
15
8
Dysphagia
11
2
10
4
Dyspnea
9
2
13
6
Treatment Emergent Adverse Events * Slide22
Adverse Events of Special Interest
Ramucirumab (N=236)
Placebo (N=115)
Category of event
Any
Grade
Grade
≥3
Any Grade
Grade ≥3
(%)
(%)
(%)
(%)
Hypertension
*
†
16
8
8
3
Bleeding
/Hemorrhage
13
3
11
3
Arteriothromboembolic
2
1
0
0
Venous
thromboembolic
4
1
7
4
Proteinuria
3
<1
<1
<1
GI
perforation
<1
<1
<1
<1
Fistula (GI and non-GI)
<1
<1
<1
<1
Infusion-related
reaction
<1
0
2
0
Cardiac failure
<1
0
0
0
†
No Grade 4 hypertension was observed among ramucirumab-treated patients
Fuchs et al. Lancet 2013Slide23
REGARD: Time to Performance Status Deterioration*
Ramucirumab
Placebo
Median
5.1 mos
2.4 mos
*Time to deterioration in ECOG PS score of 2 or worse
Fuchs et al. Lancet 2013Slide24
Median OS in randomized 2
nd
-line gastric cancer studies presented/published in 2009-2013
5.2
3.8
5.2
3.6
Ramucirumab vs PBO (BSC)
1
(n=355)
Docetaxel
vs
ASC
2
(n=131)
CTX [Docetaxel or Irinotecan]
vs
BSC
3
(n=202)
Irinotecan
vs
BSC
4
(n=40)
5.3
1. Fuchs et al. Lancet 2013
2. Ford et al. Proc
Gastrointestinal Cancer Symp 2013. LBA4
.
3. Kang et al.
J Clin Oncol
30:1513-1518, 2012
4. Thuss-Patience
et al. EUR J CANCER
47: (2011) 2306-2314.Slide25
Response Rates in randomized 2
nd
-line gastric cancer studies presented/published in 2009-2013
Ramucirumab vs PBO (BSC)
1
(n=355)
Docetaxel
vs
ASC2 (n=131) CTX [Docetaxel or Irinotecan]
vs
BSC
3
(n=202)
Irinotecan
vs
BSC
4
(n=40)
1. Fuchs et al. Lancet 2013
2. Ford et al. Proc
Gastrointestinal Cancer Symp 2013. LBA4
.
3. Kang et al.
J Clin Oncol
30:1513-1518, 2012
4. Thuss-Patience
et al. EUR J CANCER
47: (2011) 2306-2314.Slide26
Treat until disease progression or intolerable toxicity
Important inclusion criteria:
-
Metastatic or loc. adv. unresectable gastric
or
GEJ* adenocarcinoma
- Progression after 1
st
line platinum/fluoropyrimidine based chemotherapy
Stratification factors
:
-
Geographic
r
egion,
-
Measurable
vs non-measurable disease,
- Time to progression on 1
st
line therapy (<
6
mos
vs. ≥ 6
mos)
Ramucirumab
8 mg/kg
day 1&15
+ P
aclitaxel
80 mg/m
2
day 1,8 &15
of a 28-day cycle
N = 330
Placebo day 1&15
+
Paclitaxel
80 mg/m
2
day 1,8 &15
N = 335
S
C
R
E
EN
R
A
N
D
O
M
IZE
Survival and safety follow-upRAINBOW: Study Design * GEJ= gastroesophageal junction; gastric and GEJ will be summarized under the term GC
1:1Slide27
ToGA: A Randomized, Open Label Multicenter Phase III Study
27
HER2-positive*
advanced
gastric or GEJ cancer
(n=584)
Capecitabine
1
or iv 5-FU
2†
+
cisplatin
3
(n=290
)
R
*IHC 3+ or FISH+
5-FU=5-fluorouracil; GEJ=gastroesophageal junction; R=randomization;
ECOG PS =Eastern Cooperative Oncology Group performance score.
Capecitabine or iv 5-FU
2†
+ cisplatin
3
+
trastuzumab
(n=294
)
3807 patients screened
810 HER2-positive (22.1%)
Bang YJ
, et al.
Lancet.
2010;376:687-697
.
Stratification factors
Advanced vs. metastatic disease
GC vs. GEJ
Measurable vs. non-measureable
ECOG PS 0-1 vs. 2
Capecitabine vs. 5-FU
†
Chosen at investigator’s discretion
1
1000 mg/m2 bid
d
1-14 q3w x
6 cycles
2
800 mg/m2/day continuous iv infusion d1-5 q3w x 6 cycles
3
80 mg/m2 q3w x 6
cycles
4
8 mg/kg loading dose followed by 6 mg/kg q3w until disease progressionSlide28
ToGA Primary Endpoint:
Overall Survival
28
Bang YJ
, et al.
Lancet.
2010;376:687-697
.
Events
Median OS (mo)
HR
95% CI
p
-value
FC + Trastuzumab
167
13.8
0.74
0.60, 0.91
0.0046
FC
182
11.1
Time (months)
11.1
13.8
0
2
4
6
8
10
12
14
16
18
20
22
24
26
28
30
32
34
36
0.0
0.1
0.2
0.3
0.4
0.5
0.6
0.7
0.8
0.9
1.0
Probability
294
290
277
266
246
223
209
185
173
143
147
117
113
90
90
64
71
47
56
32
43
24
30
16
21
14
13
7
12
6
6
5
4
0
1
0
0
0
No.
at risk
F+C+Trastuzumab
F+C
F=fluoropyrimidine (either fluorouracil or capecitabine); C=cisplatin.Slide29
T-DM1 structure
T-DM1 is a novel ADC
Average drug:
antibody ratio ≅3.5:1
Highly potent cytotoxic agent
Monoclonal antibody: Trastuzumab
Systemically stable
Target
expression
: HER2
Cytotoxic agent: DM1
Linker: MCC
T-DM1
TrastuzumabSlide30
Phase III Study of T-DM1 Versus
Taxane in Patients With
HER-2 Gastric
Cancer
R
A
N
D
O
MIZET-DM1q 3 weeksPaclitaxel or Docetaxel
412 HER-2 pts
following first-line therapy:
Primary endpoint:
Overall Survival
T-DM1
weeklySlide31
MET Amplification as a Predictor of Drug Sensitivity in Gastric and Esophageal Adenocarcinoma
Graziano
et al J
Clin
Onc 2011:
230 pts: 10% MET amplifications
Worse prognosis
Smollen
et al PNAS, 2006
Yapp et al J Clin Onc 2011:Phase I trial of ARQ197Minor regression in gastric cancerSlide32
Second-Line Therapy for Gastric Cancer: 2014
For all patients, 2
nd
-
line ramucirumab
significantly improves
overall survival
Survival
b
enefit for ramucirumab appears comparable to 2nd-line docetaxel or irinotecanAddition of ramucirumab to 2nd-line paclitaxel significantly improves overall survival
Other novel targeted approaches that may emerge:
HER-2 directed therapy
C-MET
pathway directed
therapy
Ongoing mining of genomic data may generate the next generation of targetsSlide33
Back-up SlidesSlide34
Post-discontinuation Treatment
Ramucirumab (N=238)
Placebo (N=117)
n
(%)
n
%
Patients with any PDT*
75
(31.5)
46
(39.3)
Chemotherapy
69
(29.0)
44
(37.6)
Biologic therapy
6
(2.5)
1
(0.9)
Radiotherapy
4
(1.7)
6
(5.1)
Surgery
2
(0.8)
0
0
*
Each patient may have received more than one regimen.
PDT = Post-discontinuation TreatmentSlide35
238
156
82
169
69
181
39
18
218
20
199
39
99
92
37
201
179
59
165
55
18
41
197
67
171
96
52
90
163
75
64
174
132
65
N
(Ram)
<65
≥65
Male
Female
White
Asian
Other
Yes
No
First-Line
Adjuvant/Neo
Doublets
Triplets
≥10%
<10%
Gastric
GEJ
NA
LA
Asia
Hispanic
Not Hispanic
0
≥1
Diffuse
Intestinal
Unknown
0-2
≥3
Yes
No
<6 months
≥6 months
Subgroup
Age Group
Sex
Overall
Race
Ethnicity
ECOG PS
Measurable
Tumor
Prior Therapy
First-Line Type
Hist. Subtype
# Metastatic
Sites
PeritonealProgression-free Interval
Weight LossPrimary TumorGeo RegionCategory
117
71
467938
9117910611
103
14
633617
100853280
29
8
19983186
44353871
46
45
727428N
(Plcb)REGARD: Subgroup Analysis for OSSlide36
238
156
82
169
69
181
39
18
218
20
199
39
99
92
37
201
179
59
165
55
18
41
197
67
171
96
52
90
163
75
64
174
132
65
N
(Ram)
<65
≥65
Male
Female
White
Asian
Other
Yes
No
First-Line
Adjuvant/Neo
Doublets
Triplets
≥10%
<10%
Gastric
GEJ
NA
LA
Asia
Hispanic
Not Hispanic
0
≥1
Diffuse
Intestinal
Unknown
0-2
≥3
Yes
No
<6 months
≥6 months
Subgroup
Age Group
Sex
Overall
Race
Ethnicity
ECOG PS
Measurable
Tumor
Prior Therapy
First-Line Type
Hist. Subtype
# Metastatic Sites
Peritoneal
Progression-free IntervalWeight LossPrimary Tumor
Geo RegionCategory11771
46
79
389117
91061110314
63
36
1710085
3280298
19
98
31864435
38714645
72
74
28N(Plcb)
REGARD: Subgroup Analysis for PFS