/
Time-resolved measurement of the C Time-resolved measurement of the C

Time-resolved measurement of the C - PowerPoint Presentation

olivia-moreira
olivia-moreira . @olivia-moreira
Follow
366 views
Uploaded On 2018-02-23

Time-resolved measurement of the C - PPT Presentation

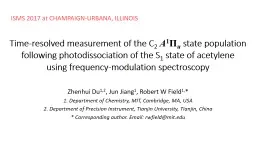
2 A 1 Π u state population following photodissociation of the S 1 state of acetylene using frequencymodulation spectroscopy Zhenhui Du 12 Jun Jiang 1 Robert W Field 1 1 Department of Chemistry MIT Cambridge MA USA ID: 634683

state signal population time signal state time population phase performance fms experimental verification transition methods lineshape frequency system resolved

Share:

Link:

Embed:

Download Presentation from below link

Download Presentation The PPT/PDF document "Time-resolved measurement of the C" is the property of its rightful owner. Permission is granted to download and print the materials on this web site for personal, non-commercial use only, and to display it on your personal computer provided you do not modify the materials and that you retain all copyright notices contained in the materials. By downloading content from our website, you accept the terms of this agreement.


Presentation Transcript

Slide1

Time-resolved measurement of the C2 A1Πu state population following photodissociation of the S1 state of acetylene using frequency-modulation spectroscopy

Zhenhui Du1,2, Jun Jiang1, Robert W Field1,*1. Department of Chemistry, MIT, Cambridge, MA, USA2. Department of Precision Instrument, Tianjin University, Tianjin, China* Corresponding author. Email: rwfield@mit.edu

ISMS 2017 at

CHAMPAIGN-URBANA

,

ILLINOISSlide2

OutlineBackgroundMethodsSystem Performance Verification Experimental ResultsSummarySlide3

BackgroundDicarbon, also called diatomic carbon, ethenediylidene and dicarbon(C—C) , chemical formula C=C or C2Exists only at high temperature, also exhibits radical characterA very important intermediate both in intermolecular and intramolecular pathwayCrucial role in the kinetic reactions, photochemistry, combustion, and so onGoal: to investigate the excited-state population behavior of C2 radical following C2H2 photolysis that occurs via the S1 levelsSlide4

Methods: SummaryAcetylene photolysis by pulsed UV laser via resonance with the S1 levelsC2 transitions are measured by time-resolved frequency modulation spectroscopy (FMS)Fluorescence of C2 and C2H* is detected simultaneously Spectral lineshape analysis to distinguish medium characterQuantitative calibration is performed by transitions of

85Rb and I2 Slide5

Methods: FMS basicFMS is Heterodyne, high-sensitivity, time-resolved, infomative......Measurement model of FMS:The in-phase term (cos θ ) depends on the imbalance between absorption of the two first-order sidebands---- absorption The in-quadrature term (sin θ ) depends on the imbalance of the average phase shift of the two first-order sidebands compared with the phase shift at the carrier frequency-----

dispersionSlide6

Methods: Distinctive FM signal lineshape For weak modulation, the in-phase term is proportional to the first derivative of the absorption lineSo, the FM lineshape is different for up and down transitionThis can be used to investigate population characterizationsDr. Jiang has theoretically and practically demonstrated it in detail

Simulated lineshapes of the in-phase and quadrature components of the demodulated FM signal

Up transition

Down transitionSlide7

Methods: Experimental setupModulation frequency: 1GHzModulation index: ~ 0.5CW, narrow linewidth

tuning range: 700-1000nmSlide8

System Performance Verification: Population inversion A λ–type excitation scheme (i.e. SEP) of I2 B–X transition is usedthe JB = 57, v

B = 32 level of the I2 B state is populated by the second harmonic of a Nd:YAG laserthe relative populations are probed by the FMSSlide9

System Performance Verification : Quantitative populations The well known 85Rb 52P1/2 ← 52S1/2 transition is used to verify the experimental system Its Hyperfine splitting in the excited 52P1/2 state 362 MHz is too small to resolvedSlide10

System Performance Verification: Timing calibrationRF signal: Synchronizing trigger

FMS time domain signalFluorescence signal by the PMTThe lags come from the different length of the cables used in the systemThe lags were calibrated with a

impulse

signal Slide11

Detected FM signalSystem Performance Verification: Time resolutionFor FM signal with good SNR (>10), the phase-amplitude information can be well extracted by

off-line data processing with only one single signal cycleWhich means the time resolution is △t=1/f, ~ 1 nsFor moderate SNR (~3), two signal cycles are sufficient, so, the time resolution is better than 2 nsSlide12

Experimental resultsDemodulated spectra of the observed 85Rb 52P1/2 ← 52S1/2 transitions and the I2 B(v = 32; J = 57) →X(

v = 26; J = 58) transitionThe FM lineshape of 85Rb transition exhibits the opposite phase elative to that of I2 Slide13

Experimental resultsObserved signal intensities of various Q-branch transitions of the C2 A–X (2; 0) bandThe rotational distributions resulting from photodissociation of the three intermediate S1 levels are slightly differentThe ratio of the maximum C2 A–X signals from the three intermediate S1 levels is C2(34 : 33 : 32) = 15 : 3 :

1Slide14

SummaryThe C2 A1Πu state population after photodissociation of the s1 state of acetylene, A(v = 2) —X(v = 0) is investigatedNo transitory population invertion was observed

Further work

The identities of the intermediate dissociation precursor states in the two two-photon photodissociation channels (C

2

X state and C

2

H*) is not known

Estimation of the total population of the long-lived C

2

H* fragment from the 15 available spectroscopic dataSlide15

Thanks for Your AttensionAny questions please to: duz@mit.edu