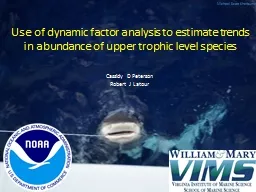
PPT-Use of dynamic factor analysis to estimate trends in abunda

Author : olivia-moreira | Published Date : 2017-06-03

Michael Scott Sherburne Cassidy D Peterson Robert J Latour Background Shark population declines 1970s 1990s Increased commercial and recreational fishery Kselected

Presentation Embed Code

Download Presentation

Download Presentation The PPT/PDF document "Use of dynamic factor analysis to estima..." is the property of its rightful owner. Permission is granted to download and print the materials on this website for personal, non-commercial use only, and to display it on your personal computer provided you do not modify the materials and that you retain all copyright notices contained in the materials. By downloading content from our website, you accept the terms of this agreement.

Use of dynamic factor analysis to estimate trends in abunda: Transcript


Michael Scott Sherburne Cassidy D Peterson Robert J Latour Background Shark population declines 1970s 1990s Increased commercial and recreational fishery Kselected life history Shark Fishery Management Plan NMFS 1993. STA431: Spring 2013. See last slide for copyright information. Factor Analysis: The Measurement Model. D. 1. D. 8. D. 7. D. 6. D. 5. D. 4. D. 3. D. 2. F. 1. F. 2. Example with 2 factors and 8 observed variables. AnnMaria De Mars, PhD.. The Julia Group & 7 Generation Games . WHY?. Imagine this. What exactly were you planning on doing with that?. Let’s say you have a massive pile of data …. . You Could:. Prepared by. Ferry . Dzulkifli. Tita. . Borshalina. FACTOR ANALYSIS. Factor Analysis Defined. Factor analysis . . .. is an interdependence technique whose primary purpose is to define the underlying structure among the variables in the analysis.. Lua Augustin, Savannah Guo, and Blair Marquardt. Learning Outcomes. To understand. :. What . is factor analysis.. What is its model.. Latent vs. observable variables; examples of each. .. Potential applications of factor analysis. The purpose of factor analysis is to discover patterns in the relationships among the . variables. Factor Analysis. Form of multiple correlations. Checking for construct validity. Do questions measure the same dimension?. http://dss.princeton.edu/training/ Factor analysis: introFactor analysis is used mostly for data reduction purposes:To get a small set of variables (preferably uncorrelated) from a large set of variab BMTRY 726. 7/19/16. Factor Rotation. Recall, can conduct orthogonal transformations of the factors and still reconstruct the covariance of . X. . Means can use orthogonal transformations of the factor loading matrix to “simplify” the interpretation of the factors. First, . let’s. . check. . the. . reliability. of . the. . scale. Go. . to. . Analyze. , . Scale. . and. . Reliability. . analysis. Select . the. . items. . and. transfer . them. . into. STA431: Spring . 2015. See last slide for copyright information. Factor Analysis: The Measurement Model. D. 1. D. 8. D. 7. D. 6. D. 5. D. 4. D. 3. D. 2. F. 1. F. 2. Example with 2 factors and 8 observed variables. Prof. Andy Field. Slide . 2. Aims. Explore factor . a. nalysis and . p. rincipal . c. omponent . a. nalysis (PCA). What . Are . factors. ?. Representing . factors. Graphs and Equations. Extracting factors. The basic objective of Factor Analysis is data reduction or structure detection.. The purpose of . data reduction.  is to remove redundant (highly correlated) variables from the data file, perhaps replacing the entire data file with a smaller number of uncorrelated variables.. Dept. of PHS, Division of . Biostats. & . Bioinf. Biostatistics Shares Resource, Hollings Cancer Center. Cancer Control Journal Club. March 3, 2016. Motivating Example. Goals of paper. 1. See if previously defined measurement model of hopelessness in advanced cancer fits this sample. Confirmatory Factor Analysis.. Andrej Srakar, . PhD. Institute . for. . Economic. . Research. , Ljubljana . and. . Faculty. of . Economics. , University of Ljubljana, . Slovenia. 1. Structure. of . the. . presentation. Research. variables. Factor Analysis. Form of multiple correlations. Checking for construct validity. Do questions measure the same dimension?. For use between or within a test. Identify items which cluster together.

Download Document

Here is the link to download the presentation.
"Use of dynamic factor analysis to estimate trends in abunda"The content belongs to its owner. You may download and print it for personal use, without modification, and keep all copyright notices. By downloading, you agree to these terms.

Related Documents