/
Surveillance for Foodborne Disease Outbreaks Surveillance for Foodborne Disease Outbreaks

Surveillance for Foodborne Disease Outbreaks - PDF document

olivia
olivia . @olivia
Follow
342 views
Uploaded On 2022-09-22

Surveillance for Foodborne Disease Outbreaks - PPT Presentation

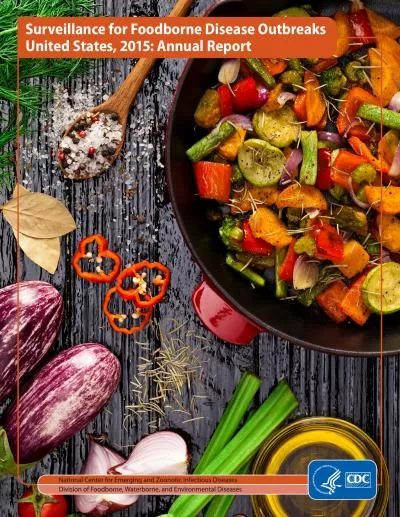
United States 2015 Annual Report Acknowledgements The 31ndings in this study are based in part on contributions by state local and territorial health departments Suggested Citation Center ID: 955396

outbreaks 150 outbreak food 150 outbreaks food outbreak etiology foodborne disease con reported rmed illnesses suspected toxin coli single

Share:

Link:

Embed:

Download Presentation from below link

Download Pdf The PPT/PDF document "Surveillance for Foodborne Disease Outbr..." is the property of its rightful owner. Permission is granted to download and print the materials on this web site for personal, non-commercial use only, and to display it on your personal computer provided you do not modify the materials and that you retain all copyright notices contained in the materials. By downloading content from our website, you accept the terms of this agreement.


Presentation Transcript

Surveillance for Foodborne Disease Outbreaks United States, 2015: Annual Report Acknowledgements The ndings in this study are based, in part, on contributions by state, local, and territorial health departments. Suggested Citation Centers for Disease Control and Prevention (CDC). Surveillance for Foodborne Disease Outbreaks, United States, 2015, Annual Report. Atlanta, Georgia: US Department of Health and Human Services, CDC, 2017. Report compiled by Daniel Dewey-Mattia, Karunya Manikonda, Julia Chen, Hannah Kisselburgh, Caroline Pilewski, Preethi Sundararaman, and Samuel Crowe Centers for Disease Control and Prevention Division of Foodborne, Waterborne, and Environmental Diseases 1600 Clifton Road, Mail Stop C-09, Atlanta, GA 30329-4027 Telephone: 404.639.2206 E-mail: NORS-Foodborne@cdc.gov Web: http://www.cdc.gov/foodsafety/fdoss/ Surveillance for Foodborne Disease Outbreaks United States 2015 Annual Report Contents Main Findings 1 Background 1 Findings 2 Limitations 3 Additional Information 4 References ............................................................................................................................... 4 Figure: Rate of reported foodborne disease outbreaks per 1 million population and number of outbreaks by state and etiology ............................................................................................................................... 4 Table 1 : Foodborne disease outbreaks, outbreak-associated illnesses, and hospitalizations, by etiology 6 Table 2a: Foodborne disease outbreaks and outbreak-associated illnesses, by food category ..................... 7 Table 2b: Most common conrmed pathogen-food category pairs resulting in outbreaks and associated illnesses, hospitalizations, and deaths 8 Table 3a: Foodborne disease outbreaks and associated illnesses, by location of food preparation 9 Table 3b: Foodborne disease outbreaks and associated illnesses, by conrmed etiology and location of food preparation 10 Table 3c: Foodborne disease outbreaks and associated illnesses, by suspected etiology and location of food preparation 11 Table 4: Multistate foodborne disease outbreaks 12 Appendix: Foodborne disease outbreaks by etiology and contributing factors 13 1 Main Findings In 2015, there were 902 foodborne disease outbreaks reported, resulting in 15,202 illnesses, 950 hospitalizations, 15 deaths, and 20 food product recalls. Norovirus was the most common cause of conrmed, single-etiology outbreaks, accounting for 164 (37%) outbreaks and 3,893 (39%) illnesses. Salmonella was the next most common cause, accounting for 149 (34%) outbreaks and 3,944 (39%) illnesses, followed by Shiga toxin-producing Escherichia coli, which caused 27 (6%) conrmed single-etiology outbreaks and 302 (3%) illnesses. Fish (34 outbreaks), chicken (22), and pork (19) were the most common single food categories implicated. The most outbreak-associated illnesses were from seeded vegetables (e.g., cucumbers or tomatoes, 1,121 illnesses), pork (924), and vegetable row crops (e.g., leafy vegetables, 383). As reported in previous years, restaurants (469 outbreaks, 60% of outbreaks reporting a single location of preparation), specically restaurants with sit-down dining (373, 48%), were the most commonly reported locations of food preparation associated with outbreaks. Background Foodborne diseases due to known pathogens are estimated to cause 9.4 million illnesses each year in the United States. 1 Although relatively few of these illnesses occur in the setting of a recognized outbreak, data collected during outbreak investigations provide insight into the pathogens and foods that cause illness. Public health ocials, regulatory agencies, and the food industry can use these data to create control strategies along the farm-to-table continuum that target specic pathogens and foods. An outbreak of foodborne disease is dened as the occurrence of two or more cases of a similar illness resulting from ingestion of a common food. Foodborne disease outbreaks are a nationally notiable condition ( http://c.ymcdn.com/sites/www.cste.org/ resource/resmgr/CSTENotiableConditionListA.pdf ). CDC conducts surveillance of foodborne disease outbreaks in the United States through the Foodborne Disease Outbreak Surveillance System. Public health agencies in all 50 states, the District of Columbia, and U.S. territories voluntarily submit reports of outbreaks investigated by their agencies using a Web- based reporting platform, the National Outbreak Reporting System (NORS) ( http://www.cdc.gov/ nors/ ). NORS also collects reports of enteric disease outbreaks with other transmission modes, including water, animal contact, person-to-person contact, environmental contamination, and unidentied modes. Agencies use a standard form ( https://www. cdc.gov/nors/downloads/form-52-13.pdf ) to report foodborne disease outbreaks. Data requested for each outbreak include: the reporting state; date of rst illness onset; number of illnesses, hospitalizations, and deaths; etiology; implicated food(s) and ingredient(s); locations of food preparation; and factors contributing to food contamination (see appendix). The reporting form also allows for reporting the reason(s) a particular food is suspected as the source; ve choices are provided ( http://www.cdc.gov/nors/downloads/guidance. pdf ). All foods implicated are included in analyses, regardless of the reasons suspected. Implicated foods in multistate outbreaks are further classied as conrmed or suspected based on epidemiologic, traceback, and laboratory evidence. A food is considered the conrmed source if two types of evidence are obtained, while a food is considered suspected if only one type of evidence is available. Reports of outbreaks on cruise ships that dock in both U.S. and international ports and those in which the food was eaten outside the United States, even if the illness occurred in the United States, are excluded from the Foodborne Disease Outbreak Surveillance System. This report includes foodborne disease outbreaks reported by October 20, 2016, in which the rst illness onset occurred in 2015. Etiologic agents were reported as conrmed if predened criteria were met; 2 otherwise, they were reported as suspected. In some outbreaks the etiologic agent is unknown. For outbreaks caused by a single conrmed or suspected etiology, etiologies were grouped as bacterial, chemical and toxin, parasitic, or viral. Multistate outbreaks were dened as outbreaks 2 in which exposure to the implicated food occurred in more than one state or territory. Population-based outbreak reporting rates were calculated for each state using U.S. Census estimates of the 2015 state populations ( http://www.census.gov/popest ). Multistate outbreaks were included in state population-based outbreak reporting rates by assigning one outbreak to each state that reported a case in the outbreak. Implicated foods were classied into 1 of 24 single- food categories if a single contaminated ingredient was identied or if all ingredients belonged to that category. 3 Outbreaks attributed to foods that could not be assigned to one of these categories, or for which the report contained insucient information for category assignment, were not attributed to any category. Findings States and Rates During 2015, there were 902 foodbo

rne disease outbreaks reported (Table 1), resulting in 15,202 illnesses, 950 hospitalizations, and 15 deaths. Outbreaks were reported by public health ocials from 50 states, Puerto Rico, and Washington D. C. (Figure). The median rate per million population was 3.5 outbreaks; rates ranged from 0.6 in Mississippi to 14.1 in Kansas. Etiologic Agents A single etiologic agent was conrmed in 443 (49%) outbreaks (Table 1), which resulted in 10,008 (66%) illnesses. Bacteria caused the most outbreaks (238 outbreaks, 54%), followed by viruses (168, 38%), chemicals (33, 7%), and parasites (4, 1%). Norovirus was the most common cause of conrmed, single-etiology outbreaks, accounting for 164 (37%) outbreaks and 3,893 (39%) illnesses. Salmonella was the next most common cause, accounting for 149 (34%) outbreaks and 3,944 (39%) illnesses. Among the 146 conrmed Salmonella outbreaks with a serotype reported, Enteritidis was the most common (51 outbreaks, 35%), followed by I 4,[5],12:i:- (15, 10%), Newport (8, 6%), and Braenderup (7, 5%). Shiga toxin-producing Escherichia coli (STEC) caused 27 conrmed, single- etiology outbreaks, of which 17 (63%) were caused by serogroup O157, 3 (11%) by O26, 2 (7%) by O103, 1 (4%) by O45, 1 (4%) by O111, 1 (4%) by O121, 1 (4%) by O145, and 1 (4%) by multiple serogroups. Illnesses, Hospitalizations, and Deaths Of the 10,008 outbreak-associated illnesses caused by a single conrmed etiologic agent, 896 (9%) resulted in hospitalization (Table 1). Among conrmed, single-etiology outbreaks, Salmonella caused the most outbreak-associated hospitalizations (573 hospitalizations, 64%), followed by STEC (106, 12%) and Shigella (53, 6%). Outbreaks caused by Clostridium botulinum resulted in the highest proportion of ill persons hospitalized (97%), followed by Listeria monocytogenes (90%) and Hepatitis A virus (38%). Among the 15 deaths reported, 14 (93%) were attributed to bacterial etiologies ( Salmonella [9], Clostridium botulinum [2], Clostridium perfringens [1], Listeria monocytogenes [1], and Vibrio vulnicus [1]). One death was attributed to norovirus. Food Categories Implicated A food was reported for 360 (40%) outbreaks. In 194 (54%) of these outbreaks, the food could be classied into 1 of the 24 categories (Table 2a); the categories most commonly implicated were sh (34 outbreaks, 18%), chicken (22, 11%), pork (19, 10%), and dairy (18, 9%). Pasteurization information was reported for 14 of the dairy outbreaks and 13 (93%) of these involved unpasteurized products. The most outbreak-associated illnesses were from seeded vegetables (e.g., cucumbers or tomatoes, 1,121 illnesses), pork (924), vegetable row crops (e.g., leafy vegetables, 383), and chicken (333). Etiologic Agents and Food Category Pairs The pathogen-food category pairs responsible for most outbreaks with a single conrmed etiologic agent were ciguatoxin in sh (20 outbreaks), scombroid toxin (histamine) in sh (10), and Salmonella in chicken (9) (Table 2b). The pathogen-food category pairs responsible for the most illnesses in outbreaks with a single conrmed etiologic agent were Salmonella in seeded vegetables (1,048 illnesses), Salmonella in pork (615), and Salmonella in vegetable row crops (263). The pathogen-food category pairs responsible 3 for the most hospitalizations in outbreaks with a single conrmed etiologic agent were Salmonella in seeded vegetables (225 hospitalizations), Salmonella in pork (70), and Staphylococcus aureus enterotoxin in chicken (31). Deaths were reported for the following pathogen-food category pairs: Salmonella in seeded vegetables (6 deaths), Clostridium botulinum in root and underground vegetables (2); Clostridium perfringens in beef, Listeria monocytogenes in vegetable row crops, Salmonella in pork, Salmonella in sprouts, and Vibrio vulnicus in mollusks (1 each). Location of Food Preparation Among the 779 outbreaks and 12,054 illnesses with a reported single location where food was prepared, 469 outbreaks (60%) and 4,757 associated illnesses (39%) were attributed to foods prepared in a restaurant (Table 3a, Table 3b, and Table 3c). Among these outbreaks, sit-down dining-style was the type of restaurant most commonly reported as the location where food was prepared (373 outbreaks, 48%). Recalls Twenty outbreaks resulted in product recalls. The foods recalled in outbreaks in which exposure occurred in one state were apple cider, bread, chicken, drink mix, ground beef, muns, pork, raw tuna, roast beef, and unpasteurized milk (1 each). Alfalfa seeds and sprouts, celery, chicken, cucumber, our, lettuce, moringa leaf powder, pork, raw tuna, and sprouted nut butter (1 each) were recalled in multistate outbreaks. Multistate Outbreaks Thirty multistate outbreaks (3% of all outbreaks) were reported (Table 4), resulting in 1,947 illnesses (12% of illnesses), 411 (42% of hospitalizations), and 7 deaths (50% of deaths). Outbreaks involved a median of 7.5 states (range: 2–40). Seventeen outbreaks were caused by Salmonella; the serotypes were Newport (3 outbreaks); multiple serotypes (3); Enteritidis (2); Paratyphi B (2); Bareilly, Braenderup, Hartford, Java, Javiana, Poona, and Virchow (1 each). Ten multistate outbreaks were caused by STEC (serogroups O157 [4 outbreaks], O103 [2], O26 [2], O145 [1], and multiple serogroups [1]). One outbreak was caused by Cyclospora cayetanensis, one by Listeria, and one by Vibrio parahaemolyticus. The foods implicated or suspected as sources for multistate Salmonella outbreaks were tomatoes (2 outbreaks), tuna sushi (1 conrmed, 1 suspected), alfalfa seeds and sprouts, chicken, cucumber, Latin-style soft cheese (suspected), moringa leaf powder, pork, raw oysters (suspected), raw tuna, sprouted nut butter, sushi (suspected), true oil puree, and an unidentied food (1 each). For STEC, implicated foods were celery and onion (serogroup O157), our (O26 and O121), pizza dough mix (suspected) (O157), pre-packaged leafy greens (suspected) (O145), pre-packaged salad (suspected) (O157), romaine lettuce (suspected) (O157), and unidentied foods (serogroups O103 [2 outbreaks] and O26 [2 outbreaks]). The food implicated in the Cyclospora cayetanensis multistate outbreak was cilantro. Raw clams and raw oysters were implicated in the Vibrio parahaemolyticus outbreak, and contaminated lettuce was implicated in the Listeria outbreak. Multistate Outbreaks Spanning Multiple Years Four multistate outbreaks investigated in 2015 are not included in the 2015 tally because the rst outbreak- associated illness occurred before 2015. Three were caused by Listeria; the implicated foods were ice cream (rst illness in 2010), caramel apples (rst illness in 2014), and cheese made with pasteurized milk (rst illness in 2014). One was caused by Salmonella; the implicated food was cashews (rst illness in 2014). Limitations The ndings in this report have at least three limitations. First, only a small proportion of foodborne illnesses that occur each year are identied as being associated with outbreaks. The extent to which the distribution of food vehicles and locations of preparation implicated in outbreaks reect the same vehicles and locations as sporadic foodborne illnesses is unknown. Similarly, not all outbreaks are identied, investigated, or reported.

Second, many outbreaks had an unknown etiology, an unknown food vehicle, or both, and conclusions drawn from outbreaks with a conrmed etiology or food vehicle might not apply to other 4 outbreaks. Finally, CDC’s outbreak surveillance system is dynamic. Agencies can submit new reports and change or delete reports as information becomes available. Therefore, the results of this analysis might dier from those in other reports. Additional Information Public health, regulatory, and food industry professionals can use this information to target prevention eorts aimed at pathogens and foods that cause the most outbreaks. Learn more about how outbreaks are reported and tracked at http://www.cdc.gov/foodsafety/fdoss/ . References 1. Scallan E, Hoekstra RM, Angulo FJ, et al. Foodborne illness acquired in the United States—major pathogens. Emerging Infectious Diseases 2011; 17(1): 7–15. 2. CDC. Guide to conrming a diagnosis in foodborne disease. Available at: http://www.cdc.gov/foodsafety/ outbreaks/investigating-outbreaks/conrming_ diagnosis.html . Accessed October 13, 2016. 3. Interagency Food Safety Analytics Collaboration (IFSAC): Completed Projects. Available at: http:// http://www.cdc.gov/foodsafety/ifsac/projects/ completed.html . Accessed October 13, 2016. Figure: Rate of reported foodborne disease outbreaks per 1 million population* and number of outbreaks, † by state ‡ and conrmed and suspected etiology § —Foodborne Disease Outbreak Surveillance System, United States, 2015. 5 1 * Cut points for outbreak rate categories determined using quartiles. Legend diers for each map. Reported outbreaks in each state. Puerto Rico reported 2 outbreaks and Washington D. C. reported 3 outbreaks (not shown). Includes 30 multistate outbreaks (i.e., outbreaks in which exposure occurred in more than one state) assigned as an outbreak to each state involved. Multistate outbreaks involved a median of 7.5 states (range: 2–40). If at least one etiology was conrmed based on dened criteria (http://www.cdc.gov/foodsafety/outbreaks/investigating-outbreaks/conrming_diagnosis.html), the outbreak was considered to have a conrmed etiology. If an etiology was reported but not conrmed, the outbreak was considered to have a suspected etiology. 6 Table 1: Foodborne disease outbreaks, outbreak-associated illnesses, and hospitalizations, by etiology (conrmed or suspected)*Foodborne Disease Outbreak Surveillance System, United States, 2015. No. Outbreaks No. Illnesses No. Hospitalizations Etiology CE SE Total % CE SE Total % CE SE Total % Bacterial Salmonella † 149 9 158 23 3944 91 4035 33 573 1 574 62 Clostridium perfringens 17 21 38 6 686 342 1028 8 0 0 0 0 Escherichia coli, Shiga toxin-producing (STEC) § 27 7 34 5 302 48 350 3 106 9 115 12 Campylobacter ‡ 21 12 33 5 212 46 258 2 16 3 19 2 Staphylococcus aureus enterotoxin 5 8 13 2 236 55 291 2 31 0 31 3 Bacillus cereus 2 6 8 1 25 28 53 0 0 0 0 0 Vibrio parahaemolyticus 4 2 6 1 49 5 54 0 1 0 1 0 Shigella¶ 4 2 6 1 234 8 242 2 53 1 54 6 Staphylococcus spp 1 3 4 1 5 10 15 0 0 0 0 0 Clostridium botulinum 4 0 4 1 36 0 36 0 35 0 35 4 Listeria monocytogenes 2 0 2 0 21 0 21 0 19 0 19 2 Vibrio vulnicus 0 1 1 0 0 2 2 0 0 1 1 0 Streptococcus, Group A 0 1 1 0 0 40 40 0 0 0 0 0 Escherichia coli, Enteropathogenic 1 0 1 0 30 0 30 0 0 0 0 0 Yersinia enterocolitica 1 0 1 0 2 0 2 0 0 0 0 0 Other 0 6 6 1 0 40 40 0 0 0 0 0 Subtotal 238 78 316 47 5782 715 6497 52 834 15 849 91 Chemical and toxin Ciguatoxin 19 2 21 3 63 10 73 1 6 0 6 1 Scombroid toxin Histamine 9 1 10 1 23 2 25 0 0 0 0 0 Puer sh tetrodotoxin 1 0 1 0 5 0 5 0 2 0 2 0 Other 4 3 7 1 24 12 36 0 0 0 0 0 Subtotal 33 6 39 6 115 24 139 1 8 0 8 1 Parasitic Cryptosporidium 2 0 2 0 105 0 105 1 0 0 0 0 Trichinella 1 0 1 0 6 0 6 0 0 0 0 0 Cyclospora 1 0 1 0 90 0 90 1 3 0 3 0 Subtotal 4 0 4 1 201 0 201 2 3 0 3 0 Viral Norovirus 164 147 311 46 3893 1652 5545 45 46 17 63 7 Hepatitis A virus 3 0 3 0 13 0 13 0 5 0 5 1 Sapovirus 1 1 2 0 4 3 7 0 0 0 0 0 Subtotal 168 148 316 47 3910 1655 5565 45 51 17 68 7 Single etiology** 443 232 675 75 10008 2394 12402 82 896 32 928 98 Multiple etiologies 8 10 18 2 283 184 467 3 11 1 12 1 Unknown etiology †† 0 209 209 23 2333 2333 2333 15 0 10 10 1 Total 451 451 902 100 10335 4867 15202 100 907 43 950 100 Abbreviations: CE = conrmed etiology; SE = suspected etiology. If at least one etiology was conrmed based on dened criteria ( http://www.cdc.gov/foodsafety/outbreaks/investigating-outbreaks/conrming_diagnosis.html ), the outbreak was considered to have a conrmed etiology. If an etiology was reported but not conrmed, the outbreak was considered to have a suspected etiology. † Salmonella serotypes causing more than ve outbreaks were Enteritidis (53 outbreaks), I 4,[5],12:i:- (17), Newport (8), Braenderup (7), and Typhimurium (6). ‡ Campylobacter jejuni (20 outbreaks), Campylobacter unknown species (12), and Campylobacter multiple species (1). § STEC serogroups O157 (21 outbreaks), O26 (4), O103 (2), O111 (1), O145 (1), O121 (1), O45 (1), multiple serogroups (1), and unknown serogroup (2). ¶ Shigella sonnei (6 outbreaks). The denominator for the individual etiology percentages is the single etiology total. The denominator for the single etiology, multiple etiologies, and unknown etiology is the total of all outbreaks. Because of rounding, numbers might not add up to the single etiology total or the total of all outbreaks. ††An etiologic agent was not conrmed or suspected based on clinical, laboratory, or epidemiologic information. 7 Table 2a: Foodborne disease outbreaks and outbreak-associated illnesses, by food category*—Foodborne Disease Outbreak Surveillance System, United States, 2015. No. Outbreaks No. Illnesses Food Category* Total % Total % Aquatic animals Crustaceans 2 1 11 0 Mollusks † 16 8 164 4 Fish 34 18 176 4 Other aquatic animals 2 1 8 0 Subtotal 54 28 359 8 Land animals Dairy ‡ 18 9 116 3 Eggs 6 3 76 2 Beef 15 8 225 5 Pork 19 10 924 21 Chicken 22 11 333 8 Turkey 7 4 137 3 Other poultry 1 1 2 0 Game 1 1 6 0 Subtotal 89 46 1819 42 Plants Sprouts 1 1 34 1 Root and other underground vegetables § 4 2 83 2 Seeded vegetables¶ 8 4 1121 26 Herbs 3 2 132 3 Vegetable row crops** 10 5 383 9 Fruits †† 6 3 62 1 Grains and beans ‡‡ 7 4 111 3 Nuts and seeds §§ 1 1 13 0 Subtotal 40 21 1939 44 Other 11 6 247 6 Food reported, attributed to a single food category ¶¶ 194 22 4364 29 Food reported with ingredients that belong t�o 1 food category 166 18 2889 19 No food reported 542 60 7949 52 Total ¶¶ 902 100 15202 100 * Interagency Food Safety Analytics Collaboration (IFSAC) food categorization scheme: http://www.cdc.gov/foodsafety/ifsac/projects/completed.html . † Bivalve mollusks (16 outbreaks). ‡ Unpasteurized dairy products (13 outbreaks), pasteurization unknown (4), and pasteurized dairy products (1). § Roots (2 outbreaks) and tubers (2). ¶ Solanaceous seeded vegetables (3 outbreaks), vine-grown seeded vegetables (3), legumes (1), and other seeded vegetables (1). ** Leafy vegetables (10 outbreaks). †† Pome fruits (4 outbreaks) and fruits not further classied (2). ‡‡ Grains (6 outbreaks) and beans (1). §§ Nuts (1 outbreak). ¶¶ The denominator for the food category percentages is the "food reported, attributed to a single food category" total. The denominator for the "

food reported attributed to a single food category", "food reported, not attributed to a single food category", and "No food reported" is the total. Because of rounding, numbers might not add up to the ”food reported, attributed to a single food category“ total or the total. 8 Table 2b: Most common conrmed pathogen-food category pairs resulting in outbreaks, outbreak-associated illnesses, hospitalizations, and deaths—Foodborne Disease Outbreak Surveillance System, United States, 2015. Top 5 pathogen-food category pairs resulting in outbreaks Etiology Food Category* No. Outbreaks No. Illnesses No. Hospitalizations No. Deaths Ciguatoxin Fish 20 71 6 0 Scombroid toxin Histamine Fish 10 25 0 0 Salmonella Chicken 9 62 9 0 Salmonella Pork 8 615 70 1 Campylobacter Dairy 8 38 8 0 Top 5 pathogen-food category pairs resulting in outbreak-associated illnesses Etiology Food Category* No. Outbreaks No. Illnesses No. Hospitalizations No. Deaths Salmonella Seeded vegetables 4 1048 225 6 Salmonella Pork 8 615 70 1 Salmonella Vegetable row crops 2 263 2 0 Norovirus Other 6 225 1 0 Clostridium perfringens Pork 5 217 0 0 Top 5 pathogen-food category pairs resulting in outbreak-associated hospitalizations Etiology Food Category* No. Outbreaks No. Illnesses No. Hospitalizations No. Deaths Salmonella Seeded vegetables 4 1048 225 6 Salmonella Pork 8 615 70 1 Staphylococcus aureus enterotoxin Chicken 2 102 31 0 Clostridium botulinum Root and other underground vegetables 2 31 30 2 Escherichia coli , Shiga toxin-producing Grains and beans 2 76 26 0 Pathogen-food category pairs resulting in outbreak-associated deaths Etiology Food Category* No. Outbreaks No. Illnesses No. Hospitalizations No. Deaths Salmonella Seeded Vegetables 4 1048 225 6 Clostridium botulinum Root and other underground vegetables 2 31 30 2 Salmonella Pork 8 615 70 1 Clostridium perfringens Beef 3 134 0 1 Salmonella Sprouts 1 34 11 1 Listeria monocytogenes Vegetable row crops 1 19 19 1 Vibrio vulnicus Mollusks 1 2 1 1 * Interagency Food Safety Analytics Collaboration (IFSAC) food categorization scheme: http://www.cdc.gov/foodsafety/ifsac/projects/completed.html . 9 Table 3a: Foodborne disease outbreaks and outbreak-associated illnesses, by location of food preparation— Foodborne Disease Outbreak Surveillance System, United States, 2015. No. Outbreaks No. Illnesses Location Total % Total % Restaurant 469 60 4757 39 Sit-down dining 373 48 3632 30 Fast-food 62 8 651 5 Buet 8 1 65 1 Other or unknown type 23 3 303 3 Multiple types 11 1 171 1 Catering or banquet facility 112 14 2880 24 Private home 73 9 873 7 Institutional location 42 5 1932 16 School 16 2 622 5 Prison or jail 11 1 988 8 Camp 6 1 104 1 Day Care 2 0 94 1 Oce or indoor workplace 5 1 58 0 Other 2 0 66 1 Other location 8 1 239 2 Other commercial location 45 6 855 7 Grocery store 23 3 572 5 Fair, festival, or temporary mobile service 5 1 104 1 Farm or dairy 9 1 140 1 Other 8 1 39 0 Hospital or nursing home 11 1 328 3 Nursing home 9 1 313 3 Hospital 2 0 15 0 Other private location 6 1 95 1 Place of worship 4 1 45 0 Other 2 0 50 0 Hotel or motel 4 1 27 0 Ship or boat 1 0 3 0 Single location* 779 86 12054 79 Multiple locations 56 6 1552 10 Unknown location 67 7 1596 10 Total 902 100 15202 100 The denominator for the location percentages is the single location total. The denominator for the single location, multiple locations, and unknown location is the total. Because of rounding, numbers might not add up to the single location total or the total. 10 Table 3b: Foodborne disease outbreaks and outbreak-associated illnesses, by conrmed* etiology and location of food preparation † —Foodborne Disease Outbreak Surveillance System, United State, 2015. Catering or banquet facility Restaurant Other commercial location Hospital or nursing home Institutional location Private home Other private location Other location Etiology NO NI NO NI NO NI NO NI NO NI NO NI NO NI NO NI Bacterial Salmonella 10 191 61 1102 9 402 1 3 5 282 21 259 1 10 3 60 Clostridium perfringens 2 44 4 92 1 57 – – 3 221 3 120 – – – – Escherichia coli, Shiga toxin-producing – – 11 120 4 25 – – – – 3 8 – – 1 25 Campylobacter 2 24 6 29 3 9 – – 2 74 4 36 – – – – Staphylococcus aureus enterotoxin 1 45 – – – – – – 2 144 1 31 1 16 – – Bacillus cereus 1 22 – – – – – – – – – – – – – – Vibrio parahaemolyticus – – 1 3 – – – – – – 1 2 – – – – Shigella – – 3 226 – – – – – – 1 8 – – – – Staphylococcus spp – – 1 5 – – – – – – – – – – – – Clostridium botulinum – – – – – – – – – – 3 34 – – – – Listeria monocytogenes – – – – – – – – – – 1 2 – – – – Vibrio vulnicus – – – – – – – – – – – – – – – – Streptococcus, Group A – – – – – – – – – – – – – – – – Escherichia coli, Enteropathogenic – – 1 30 – – – – – – – – – – – – Yersinia enterocolitica – – – – – – – – – – – – – – – – Other – – – – – – – – – – – – – – – – Subtotal 16 326 88 1607 17 493 1 3 12 721 38 500 2 26 4 85 Chemical and toxin Ciguatoxin – – 3 13 – – – – – – 15 47 – – 1 3 Scombroid toxin Histamine – – 6 15 1 2 – – – – 1 4 – – – – Puer sh tetrodotoxin – – – – – – – – – – 1 5 – – – – Other – – 2 15 2 9 – – – – – – – – – – Subtotal – – 11 43 3 11 – – – – 17 56 – – 1 3 Parasitic Cryptosporidium – – – – 1 103 – – – – – – – – – – Trichinella – – – – – – – – – – – – – – – – Cyclospora – – 1 90 – – – – – – – – – – – – Subtotal – – 1 90 1 103 – – – – – – – – – – Viral Norovirus 30 964 96 1489 6 137 2 96 7 499 3 110 3 29 3 143 Hepatitis A virus – – 2 5 – – – – – – – – – – – – Sapovirus – – 1 4 – – – – – – – – – – – – Subtotal 30 964 99 1498 6 137 2 96 7 499 3 110 3 29 3 143 Single etiology 46 1290 199 3238 27 744 3 99 19 1220 58 666 5 55 8 231 Multiple etiologies 1 10 3 50 3 45 – – 1 178 – – – – – – Total 47 1300 202 3288 30 789 3 99 20 1398 58 666 5 55 8 231 Abbreviations: NO = number of outbreaks; NI = number of illnesses. If at least one etiology was conr

med based on dened criteria ( http://www.cdc.gov/foodsafety/outbreaks/investigating-outbreaks/conrming_diagnosis.html ), the outbreak was considered to have a conrmed etiology. If an etiology was reported but not conrmed, the outbreak was considered to have a suspected etiology. † Reported locations were grouped as follows: catering or banquet facility, restaurant, other commorcial location, hospital or nursing home, other institutional location, private home, other private location, and other location (includes Hotel or motel and Ship or boat) (see Table 3a). ‡ No outbreaks in the data reported fall into this category. 11 Table 3c: Foodborne disease outbreaks and outbreak-associated illnesses, by suspected* etiology and location of food preparation † —Foodborne Disease Outbreak Surveillance System, United State, 2015. Catering or banquet facility Restaurant Other commercial location Hospital or nursing home Institutional location Private home Other private location Other location Etiology NO NI NO NI NO NI NO NI NO NI NO NI NO NI NO NI Bacterial Salmonella 2 35 1 24 – – – – 1 4 1 5 – – 1 7 Clostridium perfringens 6 150 9 80 – – – – 2 36 3 64 – – – – Escherichia coli, Shiga toxin-producing 1 16 1 5 – – – – 3 17 – – – – – – Campylobacter – – 6 17 2 8 – – 1 10 1 2 – – – – Staphylococcus aureus enterotoxin 1 21 6 28 – – – – – – 1 6 – – – – Bacillus cereus – – 6 28 – – – – – – – – – – – – Vibrio parahaemolyticus – – – – – – – – – – – – – – – – Shigella – – 2 8 – – – – – – – – – – – – Staphylococcus spp – – 2 5 – – – – – – – – – – – – Clostridium botulinum – – – – – – – – – – – – – – – – Listeria monocytogenes – – – – – – – – – – – – – – – – Vibrio vulnicus – – 1 2 – – – – – – – – – – – – Streptococcus, Group A – – – – – – – – 1 40 – – – – – – Escherichia coli, Enteropathogenic – – – – – – – – – – – – – – – – Yersinia enterocolitica – – – – – – – – – – – – – – – – Other 2 17 2 12 1 5 – – – – – – – – – – Subtotal 12 239 36 209 3 13 – – 8 107 6 77 – – 1 7 Chemical and toxin Ciguatoxin – – – – – – – – 1 6 1 4 – – – – Scombroid toxin Histamine – – – – – – – – – – 1 2 – – – – Puer sh tetrodotoxin – – – – – – – – – – – – – – – – Other – – – – 2 8 – – – – – – – – – – Subtotal – – – – 2 8 – – 1 6 2 6 – – – – Parasitic Cryptosporidium – – – – – – – – – – – – – – – – Trichinella – – – – – – – – – – – – – – – – Cyclospora – – – – – – – – – – – – – – – – Subtotal – – – – – – – – – – – – – – – – Viral Norovirus 15 471 106 648 3 12 3 85 5 229 3 39 – – – – Hepatitis A virus – – – – – – – – – – – – – – – – Sapovirus – – 1 3 – – – – – – – – – – – – Subtotal 15 471 107 651 3 12 3 85 5 229 3 39 – – – – Single etiology 27 710 144 863 8 33 3 85 14 342 12 130 – – 1 7 Multiple etiologies 2 45 5 36 – – – – – – – – – – – – Unknown etiology § 36 825 118 570 7 33 5 144 8 192 3 77 1 40 4 31 Total 65 1580 267 1469 15 66 8 229 22 534 15 207 1 40 5 38 Abbreviations: NO = number of outbreaks; NI = number of illnesses. If at least one etiology was conrmed based on dened criteria ( http://www.cdc.gov/foodsafety/outbreaks/investigating-outbreaks/conrming_diagnosis.html ), the outbreak was considered to have a conrmed etiology. If an etiology was reported but not conrmed, the outbreak was considered to have a suspected etiology. † Reported locations were grouped as follows: catering or banquet facility, restaurant, other commorcial location, hospital or nursing home, other institutional location, private home, other private location, and other location (includes Hotal or motel and Ship or boat) (see Table 3a). ‡ No outbreaks in the data reported fall into this category. § An etiologic agent was not conrmed or suspected based on clinical, laboratory, or epidemiologic information. 12 Table 4: Multistate foodborne disease outbreaks, United States, 2015. Implicated food* Month of rst illness onset Etiology No. illnesses No. hospitalizations No. deaths No. states involved Name Conrmed Recall March Salmonella serotype Paratyphi B 11 2 0 3 Lettuce Yes No March Salmonella serotypes Weltevreden and Paratyphi B 69 12 0 11 Raw tuna Yes Yes March Shiga toxin-producing E. coli O103 6 0 0 3 No food reported - No March Salmonella serotype Newport 25 3 0 10 Latin-style soft cheese No No March Shiga toxin-producing E. coli O157:H7 16 10 0 8 Romaine lettuce No No April Salmonella serotype Enteritidis 15 4 0 7 Chicken Yes Yes April Shiga toxin-producing E. coli O145 7 5 0 3 Prepackaged leafy greens No No April Salmonella serotypes Infantis and I 4,[5],12:i:- 192 30 0 5 Pork Yes Yes May Salmonella serotype Hartford 19 4 0 6 Tomatoes No No May Cyclospora cayetanensis 90 3 0 3 Cilantro No No May Salmonella serotype Paratyphi B 5 2 0 2 Tuna sushi No No June Vibrio parahaemolyticus 42 1 0 10 Raw oysters; raw clams Yes No June Listeria monocytogenes 19 19 1 9 Lettuce Yes Yes June Salmonella serotype Newport 15 2 0 8 Raw oysters No No July Salmonella serotype Poona 907 204 6 40 Cucumber Yes Yes July Salmonella serotype Java 13 0 0 10 Sprouted nut butter Yes Yes July Salmonella serotype Javiana 37 16 0 5 No food reported - No August Salmonella serotype Enteritidis 81 2 0 10 Truffle oil puree Yes No August Salmonella serotype Bareilly 8 0 0 8 Tuna sushi Yes No August Salmonella serotype Newport 119 17 0 2 Tomato Yes No September Salmonella serotype Braenderup 20 4 0 7 Sushi No No October S higa toxin-producing E. coli O26 53 21 0 11 No food reported - No October Shiga toxin-producing E. coli O157:H7 5 3 0 4 Pre-packaged salad No No October Shiga toxin-producing E. coli O103

4 0 0 3 No food reported - No October Shiga toxin-producing E. coli O157:H7 19 3 0 7 Celery; onion Yes Yes November Shiga toxin-producing E. coli O26 5 1 0 3 No food reported - No December Salmonella serotypes Kentucky, Cubana, and Muenchen 34 11 1 14 Alfalfa sprouts; alfalfa sprout seeds Yes Yes December Shiga toxin-producing E. coli O26:NM and O121 63 17 0 24 Flour Yes Yes December Salmonella serotype Virchow 35 6 0 24 Moringa leaf powder Yes Yes December Shiga toxin-producing E. coli O157:H7 13 9 0 9 Pizza dough mix No No Implicated foods in multistate outbreaks are further classied as conrmed or suspected based on epidemiologic, traceback, and laboratory evidence. A food is considered the conrmed source if two types of evidence are obtained, while a food is considered suspected if only one type of evidence is available. 13 Appendix Table 1: Foodborne disease outbreaks by conrmed etiology* and contributing factors—Foodborne Disease Outbreak Surveillance System, United States, 2015. Contamination Factors No. outbreaks with reported contributing factors Total No. outbreaks Etiology C1 C2 C3 C4 C5 C6 C7 C8 C9 C10 C11 C12 C13 C14 C15 1 factor reported Bacterial Salmonella – – – – 1 17 13 2 26 5 3 4 1 9 8 61 71 149 Clostridium perfringens 1 – – – – 4 – – 1 – – – – 1 1 6 14 17 Escherichia coli, Shiga toxin-producing – – – – – 2 6 2 3 – – – – 1 2 10 11 27 Campylobacter – – – – – 4 4 – 2 – – – – – 1 10 13 21 Staphylococcus aureus enterotoxin 1 – – – – – – – – 1 – – – – – 2 3 5 Bacillus cereus – – – – – – – – – – – – – – – – 1 2 Vibrio parahaemolyticus – – – – – – 2 – – – – – – – – 2 3 4 Shigella – – – – – – – – – 2 – – – – – 2 2 4 Staphylococcus spp – – – – – – – – – – – – – 1 – 1 1 1 Clostridium botulinum 1 – – – – 1 1 – – – – 1 – – – 4 4 4 Listeria monocytogenes – – – – – – 1 – – – – – – – – 1 1 2 Vibrio vulnicus – – – – – – – – – – – – – – – – – – Streptococcus, Group A – – – – – – – – – – – – – – – – – – Escherichia coli, Enteropathogenic – – – – – – – – – – – – – – – – – 1 Yersinia enterocolitica – – – – – – – – – – – – – – – – – 1 Other – – – – – – – – – – – – – – – – – – Subtotal 3 – – – 1 28 27 4 32 8 3 5 1 12 12 99 124 238 Chemical and toxin Ciguatoxin 18 – – – – – – – – – – – – – 1 19 19 19 Scombroid toxin Histamine 7 – – – – – – – – – – – – – – 7 8 9 Puer sh tetrodotoxin 1 – – – – – – – – – – – – – – 1 1 1 Other – – 2 – – – – – – – – – – – – 2 2 4 Subtotal 26 – 2 – – – – – – – – – – – 1 29 30 33 Parasitic Cryptosporidium – – – – – – 1 – – – – – – – – 1 1 2 Trichinella – – – – – 1 – – – – – – – – – 1 1 1 Cyclospora – – – – – – 1 – – – – – – – – 1 1 1 Subtotal – – – – – 1 2 – – – – – – – – 3 3 4 Viral Norovirus – – – – – – 6 – 3 34 24 22 11 2 6 83 86 164 Hepatitis A virus – – – – – – – – – – – – – – – – – 3 Sapovirus – – – – – – – – – – – – – – – – – 1 Subtotal – – – – – – 6 – 3 34 24 22 11 2 6 83 86 168 Single etiology 29 – 2 – 1 29 35 4 35 42 27 27 12 14 19 214 243 443 Multiple etiologies – – – – – – 2 – – 2 1 1 1 – – 5 5 8 Total 29 – 2 – 1 29 37 4 35 44 28 28 13 14 19 219 248 451 Appendices’ footnotes are on page 19. 14 Appendix Table 2: Foodborne disease outbreaks by conrmed etiology* and contributing factors—Foodborne Disease Outbreak Surveillance System, United States, 2015. Proliferation Amplication Factors No. outbreaks with reported contributing factors Total No. outbreaks Etiology P1 P2 P3 P4 P5 P6 P7 P8 P9 P10 P11 P12 1 factor reported Bacterial Salmonella 22 13 1 1 8 5 8 8 1 – 1 1 42 71 149 Clostridium perfringens 5 5 – 1 2 1 7 7 – – – 3 14 14 17 Escherichia coli, Shiga toxin-producing 1 – – 1 – – – – – – – 3 4 11 27 Campylobacter 3 – – 3 – – 1 – – – – – 6 13 21 Staphylococcus aureus enterotoxin – – – – 1 – 1 – – – – – 2 3 5 Bacillus cereus – – – – – 1 1 1 – – – 1 1 1 2 Vibrio parahaemolyticus – – – – – – – – – – – 1 1 3 4 Shigella 1 – – – – – – – – – – – 1 2 4 Staphylococcus spp 1 1 – – 1 – – – – – – – 1 1 1 Clostridium botulinum 2 – – – 1 – 1 – – – 1 2 4 4 4 Listeria monocytogenes – – – – – – – – – – – – – 1 2 Vibrio vulnicus – – – – – – – – – – – – – – – Streptococcus, Group A – – – – – – – – – – – – – – – Escherichia coli, Enteropathogenic – – – – – – – – – – – – – – 1 Yersinia enterocolitica – – – – – – – – – – – – – – 1 Other – – – – – – – – – – – – – – – Subtotal 35 19 1 6 13 7 19 16 1 – 2 11 76 124 238 Chemical and toxin Ciguatoxin – – – – – – – – – – – – – 19 19 Scombroid toxin Histamine – – – 2 1 – – – – – – 1 4 8 9 Puer sh tetrodotoxin – – – – – – – – – – – – – 1 1 Othe

r – – – – – – – – – – – – – 2 4 Subtotal – – – 2 1 – – – – – – 1 4 30 33 Parasitic Cryptosporidium – – – – – – – – – – – – – 1 2 Trichinella – – – – – – – – – – – – – 1 1 Cyclospora – – – – – – – – – – – – – 1 1 Subtotal – – – – – – – – – – – – – 3 4 Viral Norovirus 2 1 – 1 2 – 1 – – – – – 5 86 164 Hepatitis A virus – – – – – – – – – – – – – – 3 Sapovirus – – – – – – – – – – – – – – 1 Subtotal 2 1 – 1 2 – 1 – – – – – 5 86 168 Single etiology 37 20 1 9 16 7 20 16 1 – 2 12 85 243 443 Multiple etiologies – – – – – – – 1 – – – 1 2 5 8 Total 37 20 1 9 16 7 20 17 1 – 2 13 87 248 451 Appendices’ footnotes are on page 19. 15 Appendix Table 3: Foodborne disease outbreaks by conrmed etiology* and contributing factors—Foodborne Disease Outbreak Surveillance System, United States, 2015. Survival Factors No. outbreaks with reported contributing factors Total No. outbreaks Etiology S1 S2 S3 S4 S5 1 factor reported Bacterial Salmonella 23 9 1 5 10 39 71 149 Clostridium perfringens 4 6 1 – 5 13 14 17 Escherichia coli, Shiga toxin-producing 3 – – – 3 6 11 27 Campylobacter 5 1 – – 1 7 13 21 Staphylococcus aureus enterotoxin 1 1 – – 1 3 3 5 Bacillus cereus – 1 – – 1 1 1 2 Vibrio parahaemolyticus – – – – – – 3 4 Shigella – – – – 1 1 2 4 Staphylococcus spp – – – – – – 1 1 Clostridium botulinum 1 – – – 2 3 4 4 Listeria monocytogenes – – – – – – 1 2 Vibrio vulnicus – – – – – – – – Streptococcus, Group A – – – – – – – – Escherichia coli, Enteropathogenic – – – – – – – 1 Yersinia enterocolitica – – – – – – – 1 Other – – – – – – – – Subtotal 37 18 2 5 24 73 124 238 Chemical and toxin Ciguatoxin – – – – – – 19 19 Scombroid toxin Histamine – – – – 1 1 8 9 Puer sh tetrodotoxin – – – – – – 1 1 Other – – – – – – 2 4 Subtotal – – – – 1 1 30 33 Parasitic Cryptosporidium – – – – – – 1 2 Trichinella 1 – – – – 1 1 1 Cyclospora – – – – – – 1 1 Subtotal 1 – – – – 1 3 4 Viral Norovirus – 1 – 2 5 7 86 164 Hepatitis A virus – – – – – – – 3 Sapovirus – – – – – – – 1 Subtotal – 1 – 2 5 7 86 168 Single etiology 38 19 2 7 30 82 243 443 Multiple etiologies – – – – 1 1 5 8 Total 38 19 2 7 31 83 248 451 Appendices’ footnotes are on page 19. 16 Appendix Table 4: Foodborne disease outbreaks by suspected etiology* and contributing factors—Foodborne Disease Outbreak Surveillance System, United States, 2015. Contamination Factors No. outbreaks with reported contributing factors Total No. outbreaks Etiology C1 C2 C3 C4 C5 C6 C7 C8 C9 C10 C11 C12 C13 C14 C15 1 factor reported Bacterial Salmonella – – – – – – – – – – – – – – – – 1 9 Clostridium perfringens 2 – – – – 1 – – – 1 – – – 1 3 7 16 21 Escherichia coli, Shiga toxin-producing – – – – – – – – – – – – – – – – – 7 Campylobacter – – – – – 2 2 – – – – – – – – 4 6 12 Staphylococcus aureus enterotoxin – – – – – – – – 1 1 – 1 – – 2 5 5 8 Bacillus cereus – – – – – – – – – 1 – – – 1 – 2 3 6 Vibrio parahaemolyticus 1 – – – – – 1 – – – – – – – – 1 2 2 Shigella – – – – – – – – – – – 1 – – – 1 1 2 Staphylococcus spp – – – – – – – – – 1 – – – – – 1 2 3 Clostridium botulinum – – – – – – – – – – – – – – – – – – Listeria monocytogenes – – – – – – – – – – – – – – – – – – Vibrio vulnicus – – – – – – 1 – – – – – – – – 1 1 1 Streptococcus, Group A – – – – – – – – – – – – – – – – – 1 Escherichia coli, Enteropathogenic – – – – – – – – – – – – – – – – – – Yersinia enterocolitica – – – – – – – – – – – – – – – – – – Other – – – – – – – – – – – – – – – – 2 6 Subtotal 3 – – – – 3 4 – 1 4 – 2 – 2 5 22 39 78 Chemical and toxin Ciguatoxin – – – – – – – – – – – – – – 1 1 1 2 Scombroid toxin Histamine – – – – – – – – – – – – – – – – – 1 Puer sh tetrodotoxin – – – – – – – – – – – – – – – – – – Other – – – – – – – – – – – – – – 1 1 1 3 Subtotal – – – – – – – – – – – – – – 2 2 2 6 Parasitic Cryptosporidium – – – – – – – – – – – – – – – – – – Trichinella – – – – – – – – – – – – – – – – – – Cyclospora – – – – – – – – – – – – – – – – – – Subtotal – – – – – – – – – – – – – – – – – – Viral Norovirus – – – – – – 2 1 3 23 13 8 2 2 15 46 51 147 Hepatitis A virus – – – – – – – – – – – – – – – – – – Sapovirus – – – – – – – &

#150; – – – – – – – – – 1 Subtotal – – – – – – 2 1 3 23 13 8 2 2 15 46 51 148 Single etiology 3 – – – – 3 6 1 4 27 13 10 2 4 22 70 92 232 Multiple etiologies – – – – – – – – – 1 – – – – – 1 3 10 Unknown etiology 1 1 – – – 2 3 – 11 9 3 4 – 15 18 44 54 209 Total 4 1 – – – 5 9 1 15 37 16 14 2 19 40 115 149 451 Appendices’ footnotes are on page 19. 17 Appendix Table 5: Foodborne disease outbreaks by suspected etiology* and contributing factors—Foodborne Disease Outbreak Surveillance System, United States, 2015. Proliferation Amplication Factors No. outbreaks with reported contributing factors Total No. outbreaks Etiology P1 P2 P3 P4 P5 P6 P7 P8 P9 P10 P11 P12 1 factor reported Bacterial Salmonella – – – – 1 – – – – – – – 1 1 9 Clostridium perfringens 7 4 1 – 2 – 9 6 – – – 1 16 16 21 Escherichia coli, Shiga toxin-producing – – – – – – – – – – – – – – 7 Campylobacter 2 – – – – – – 1 – – – – 3 6 12 Staphylococcus aureus enterotoxin – 3 – 1 1 – 2 1 – – – – 5 5 8 Bacillus cereus – – – – – – 1 2 – – – – 2 3 6 Vibrio parahaemolyticus – – – – – – – – 1 – – – 1 2 2 Shigella – – – – – – – – – – – – – 1 2 Staphylococcus spp 2 1 – – 1 – – 1 – – – – 2 2 3 Clostridium botulinum – – – – – – – – – – – – – – – Listeria monocytogenes – – – – – – – – – – – – – – – Vibrio vulnicus – – – – – – – – – – – – – 1 1 Streptococcus, Group A – – – – – – – – – – – – – – 1 Escherichia coli, Enteropathogenic – – – – – – – – – – – – – – – Yersinia enterocolitica – – – – – – – – – – – – – – – Other – 1 – – 1 – 1 – – – – – 2 2 6 Subtotal 11 9 1 1 6 – 13 11 1 – – 1 32 39 78 Chemical and toxin Ciguatoxin 1 1 – – – – – – – – – 1 1 1 2 Scombroid toxin Histamine – – – – – – – – – – – – – – 1 Puer sh tetrodotoxin – – – – – – – – – – – – – – – Other – – – – – – – – – – – – – 1 3 Subtotal 1 1 – – – – – – – – – 1 1 2 6 Parasitic Cryptosporidium – – – – – – – – – – – – – – – Trichinella – – – – – – – – – – – – – – – Cyclospora – – – – – – – – – – – – – – – Subtotal – – – – – – – – – – – – – – – Viral 2 – – 1 1 – 5 2 – – – – 9 51 147 Norovirus – – – – – – – – – – – – – – – Hepatitis A virus – – – – – – – – – – – – – – 1 Sapovirus 2 – – 1 1 – 5 2 – – – – 9 51 148 Subtotal 14 10 1 2 7 – 18 13 1 – – 2 42 92 232 Single etiology 2 – – – – – – – – – – 1 2 3 10 Multiple etiologies 11 12 5 5 13 – 8 7 2 1 – 3 35 54 209 Unknown etiology 27 22 6 7 20 – 26 20 3 1 – 6 79 149 451 Total 23 17 5 18 31 3 27 25 2 – – 7 87 156 398 Appendices’ footnotes are on page 19. 18 Appendix Table 6: Foodborne disease outbreaks by suspected etiology* and contributing factors—Foodborne Disease Outbreak Surveillance System, United States, 2015. Survival Factors No. outbreaks with reported contributing factors Total No. outbreaks Etiology S1 S2 S3 S4 S5 1 factor reported Bacterial Salmonella – – – – – – 1 9 Clostridium perfringens 2 10 – – 1 11 16 21 Escherichia coli, Shiga toxin-producing – – – – – – – 7 Campylobacter 3 – – – – 3 6 12 Staphylococcus aureus enterotoxin – 1 – – – 1 5 8 Bacillus cereus – 1 – 1 1 2 3 6 Vibrio parahaemolyticus – – – – – – 2 2 Shigella – – – – – – 1 2 Staphylococcus spp 1 – – – – 1 2 3 Clostridium botulinum – – – – – – – – Listeria monocytogenes – – – – – – – – Vibrio vulnicus – – – – – – 1 1 Streptococcus, Group A – – – – – – – 1 Escherichia coli, Enteropathogenic – – – – – – – – Yersinia enterocolitica – – – – – – – – Other – – – – – – 2 6 Subtotal 6 12 – 1 2 18 39 78 Chemical and toxin Ciguatoxin – – – – – – 1 2 Scombroid toxin Histamine – – – – – – – 1 Puer sh tetrodotoxin – – – – – – – – Other – – – – – – 1 3 Subtotal – – – – – – 2 6 Parasitic Cryptosporidium – – – – – – – – Trichinella – – – – – – – – Cyclospora – – – – – – – – Subtotal – – – – – – – – Viral Norovirus – 1 – 3 2 6 51 147 Hepatitis A virus – – – – – – – – Sapovirus – – – – – – – 1 Subtotal – 1 – 3 2 6 51 148 Single etiology 6 13 – 4 4 24 92 232 Multiple etiologies – 1 – – – 1 3 10 Unknown etiology 4 5 – 2 6 17 54 209 Total 10 19 – 6 10 42 149 451 Appendices’ footnotes are on page 19. 19 Appendix: Reported foodborne disease outbreaks, by conrmed and suspected etiology* and contributing factors † —Foodborne Disease Outbreak Surveillance System, United States, 2015 If at least one etiology was laboratory-conrmed, the outbreak was considered to have a conrmed etiology. If no etiology was laboratory-conrmed but an etiology was reported based on clinical or epidemiologic features, the outbreak was considered to have a suspected etiology.. † Contributing factors are dened as risk factors that either enable an outbreak

to occur or amplify an outbreak caused by other means. Contributing factors are classied into three categories: contamination factors (factors that introduce or otherwise permit contamination), proliferation/amplication factors (factors that allow proliferation or growth of the etiologic agent), and survival factors (factors that allow survival or fail to inactivate a contaminant). More than one contributing factor might be reported per outbreak. ‡ Contributing factors: C1: toxic substance part of the tissue C2: poisonous substance intentionally/deliberately added C3: poisonous substance accidentally/inadvertently added C4: addition of excessive quantities of ingredients that are toxic in large amounts C5: toxic container C6: contaminated raw product—food that was intended to be consumed after a kill step C7: contaminated raw product—food was intended to be consumed raw or undercooked/underprocessed C8: foods originating from sources shown to be contaminated or polluted (such as a growing eld or harvest area) C9: cross-contamination of ingredients (cross-contamination does not include ill food workers) C10: bare-handed contact by a food handler/worker/preparer who is suspected to be infectious C11: glove-handed contact by a food handler/worker/preparer who is suspected to be infectious C12: other mode of contamination (excluding cross-contamination) by a food handler/worker/preparer who is suspected to be infectious C13: foods contaminated by non-food handler/worker/preparer who is suspected to be infectious C14: storage in a contaminated environment C15: other source of contamination P1: food preparation practices that support proliferation of pathogens (during food preparation) P2: no attempt was made to control the temperature of implicated food or the length of time food was out of temperature control (during food service or display of food) P3: improper adherence of approved plan to use Time as a Public Health Control P4: improper cold holding due to malfunctioning refrigeration equipment P5: improper cold holding due to an improper procedure or protocol P6: improper hot holding due to malfunctioning equipment P7: improper hot holding due to improper procedure or protocol P8: improper/slow cooling P9: prolonged cold storage P10: inadequate modied atmospheric packaging P11: inadequate processing (acidication, water activity, fermentation) P12: other situations that promoted or allowed microbial growth or toxin production S1: insucient time and/or temperature control during initial cooking/heat processing S2: insucient time and/or temperature during reheating S3: insucient time and/or temperature control during freezing S4: insucient or improper use of chemical processes designed for pathogen destruction S5: other process failures that permit pathogen survival § No outbreaks in the data reported fall in this category. ¶ An etiologic agent was not conrmed or suspected based on clinical, laboratory, or epidemiologic information. For more information, please contact: Centers for Disease Control and Prevention 1600 Clifton Road NE, Atlanta, GA 30333 Telephone: 1-800-CDC-INFO (232-4636) TTY: 1-888-232-6348 E-mail: cdcinfo@cdc.gov Web: http://www.cdc.gov CS275193-A Surveillance for Foodborne Disease Outbreaks, United States2015 | Annual Report Surveillance for Foodborne Disease Outbreaks, United States 2015 | Annual Report Surveillance for Foodborne Disease Outbreaks, United States 2015 | Annual Report Surveillance for Foodborne Disease Outbreaks, United States2015 | Annual Report Surveillance for Foodborne Disease Outbreaks, United States2015 | Annual Report Surveillance for Foodborne Disease Outbreaks, United States2015 | Annual Report Surveillance for Foodborne Disease Outbreaks United States, 2015: Annual Report 1 Main Findings In 2015, there were 902 foodborne disease outbreaks reported, resulting in 15,202 illnesses, 950 hospitalizations, 15 deaths, and 20 food product recalls. Norovirus was the most common cause of conrmed, single-etiology outbreaks, accounting for 164 (37%) outbreaks and 3,893 (39%) illnesses. Salmonella was the next most common cause, accounting for 149 (34%) outbreaks and 3,944 (39%) illnesses, followed by Shiga toxin-producing Escherichia coli, which caused 27 (6%) conrmed single-etiology outbreaks and 302 (3%) illnesses. Fish (34 outbreaks), chicken (22), and pork (19) were the most common single food categories implicated. The most outbreak-associated illnesses were from seeded vegetables (e.g., cucumbers or tomatoes, 1,121 illnesses), pork (924), and vegetable row crops (e.g., leafy vegetables, 383). As reported in previous years, restaurants (469 outbreaks, 60% of outbreaks reporting a single location of preparation), specically restaurants with sit-down dining (373, 48%), were the most commonly reported locations of food preparation associated with outbreaks. BackgroundFoodborne diseases due to known pathogens are estimated to cause 9.4 million illnesses each year in the United States. Although relatively few of these illnesses occur in the setting of a recognized outbreak, data collected during outbreak investigations provide insight into the pathogens and foods that cause illness. Public health ocials, regulatory agencies, and the food industry can use these data to create control strategies along the farm-to-table continuum that target specic pathogens and foods. An outbreak of foodborne disease is dened as the occurrence of two or more cases of a similar illness resulting from ingestion of a common food.Foodborne disease outbreaks are a nationally notiable condition (http://c.ymcdn.com/sites/www.cste.org/resource/resmgr/CSTENotiableConditionListA.pdf). CDC conducts surveillance of foodborne disease outbreaks in the United States through the Foodborne Disease Outbreak Surveillance System. Public health agencies in all 50 states, the District of Columbia, and U.S. territories voluntarily submit reports of outbreaks investigated by their agencies using a Web-based reporting platform, the National Outbreak Reporting System (NORS) (http://www.cdc.gov/). NORS also collects reports of enteric disease outbreaks with other transmission modes, including water, animal contact, person-to-person contact, environmental contamination, and unidentied modes. Agencies use a standard form (https://www.cdc.gov/nors/downloads/form-52-13.pdf) to report foodborne disease outbreaks. Data requested for each outbreak include: the reporting state; date of rst illness onset; number of illnesses, hospitalizations, and deaths; etiology; implicated food(s) and ingredient(s); locations of food preparation; and factors contributing to food contamination (see appendix). The reporting form also allows for reporting the reason(s) a particular food is suspected as the source; ve choices are provided http://www.cdc.gov/nors/downloads/guidance.). All foods implicated are included in analyses, regardless of the reasons suspected. Implicated foods in multistate outbreaks are further classied as conrmed or suspected based on epidemiologic, traceback, and laboratory evidence. A food is considered the conrmed source if two types of evidence are obtained, while a food is considered suspected if only one type of evidence is available. Reports of outbreaks on cruise ships that dock in both U.S. and international ports and those in which the food was eaten outside the United States, even if the illness occurred in the United States, are excluded from

the Foodborne Disease Outbreak Surveillance System.This report includes foodborne disease outbreaks reported by October 20, 2016, in which the rst illness onset occurred in 2015. Etiologic agents were reported as conrmed if predened criteria were met; otherwise, they were reported as suspected. In some outbreaks the etiologic agent is unknown. For outbreaks caused by a single conrmed or suspected etiology, etiologies were grouped as bacterial, chemical and toxin, parasitic, or viral. Multistate outbreaks were dened as outbreaks ContentsMain Findings ............................................................................................................................... Background ............................................................................................................................... Findings ............................................................................................................................... Limitations ............................................................................................................................... Additional Information ............................................................................................................................... ReferencesFigure: Rate of reported foodborne disease outbreaks per 1 million population and number of outbreaks by state and etiology ................................................................................................................................................. Table 1: Foodborne disease outbreaks, outbreak-associated illnesses, and hospitalizations, by etiology ............................................................................................................................... Table 2a: Foodborne disease outbreaks and outbreak-associated illnesses, by food category ..................... Table 2b: Most common conrmed pathogen-food category pairs resulting in outbreaks and associated illnesses, hospitalizations, and deaths ...................................................................................................... Table 3a: Foodborne disease outbreaks and associated illnesses, by location offood preparation ............................................................................................................................... Table 3b: Foodborne disease outbreaks and associated illnesses, by conrmed etiology and location of food preparation ............................................................................................................................... Table 3c: Foodborne disease outbreaks and associated illnesses, by suspected etiology and location of food preparation ............................................................................................................................... Table 4: Multistate foodborne disease outbreaks .......................................................................................................... Appendix: Foodborne disease outbreaks by etiology and contributing factors ............................................... 13 Surveillance for Foodborne Disease Outbreaks United States 2015 Annual Report AcknowledgementsThe ndings in this study are based, in part, on contributions by state, local, and territorial health departments. Suggested CitationCenters for Disease Control and Prevention (CDC). Surveillance for Foodborne Disease Outbreaks, United States, 2015, Annual Report. Atlanta, Georgia: US Department of Health and Human Services, CDC, 2017.Report compiled byDaniel Dewey-Mattia, Karunya Manikonda, Julia Chen, Hannah Kisselburgh, Caroline Pilewski, Preethi Sundararaman, and Samuel Crowe Centers for Disease Control and PreventionDivision of Foodborne, Waterborne, and Environmental Diseases1600 Clifton Road, Mail Stop C-09, Atlanta, GA 30329-4027Telephone: 404.639.2206NORS-Foodborne@cdc.govWeb: http://www.cdc.gov/foodsafety/fdoss/ 5 1 * Cut points for outbreak rate categories determined using quartiles. Legend diers for each map. Reported outbreaks in each state. Puerto Rico reported 2 outbreaks and Washington D. C. reported 3 outbreaks (not shown). Includes 30 multistate outbreaks (i.e., outbreaks in which exposure occurred in more than one state) assigned as an outbreak to each state involved. Multistate outbreaks involved a median of 7.5 states (range: 2–40). If at least one etiology was conrmed based on dened criteria (http://www.cdc.gov/foodsafety/outbreaks/investigating-outbreaks/conrming_diagnosis.html), the outbreak was considered to have a conrmed etiology. If an etiology was reported but not conrmed, the outbreak was considered to have a suspected etiology. 6 Table 1: Foodborne disease outbreaks, outbreak-associated illnesses, and hospitalizations, by etiology (conrmed or suspected)* — oodborne Disease Outbreak Surveillance System, United States, 2015. No. OutbreaksNo. IllnessesNo. HospitalizationsEtiologyTotalTotalTotalBacterialSalmonella14915839444035573574Clostridium perfringens6863421028Escherichia coli, Shiga toxin-producing (STEC)302350106115Campylobacter212258Staphylococcus aureus enterotoxin236291Bacillus cereusVibrio parahaemolyticus234242Staphylococcus spp Clostridium botulinumListeria monocytogenesVibrio vulnicusStreptococcus, Group AEscherichia coli, EnteropathogenicYersinia enterocoliticaOtherSubtotal2383165782715649752834849Chemical and toxinCiguatoxinScombroid toxin / HistaminePuer sh tetrodotoxinOtherSubtotal115139ParasiticCryptosporidium105105TrichinellaCyclosporaSubtotal201201ViralNorovirus164147311389316525545Hepatitis A virusSapovirus Subtotal168148316391016555565684432326751000823941240289692898283184467Unknown etiology209209233323332333Total4514519021001033548671520210090743950100Abbreviations: CE = conrmed etiology; SE = suspected etiology. * f at least one etiology was conrmed based on dened criteria ( http://www.cdc.gov/foodsafety/outbreaks/investigating-outbreaks/conrming_diagnosis.html), the outbreak was considered to have a conrmed etiology. If an etiology was reported but not conrmed, the outbreak was considered to have a suspected etiology.Salmonella serotypes causing more than ve outbreaks were Enteritidis (53 outbreaks), I 4,[5],12:i:- (17), Newport (8), Braenderup (7), and Typhimurium (6).Campylobacter jejuni (20 outbreaks), Campylobacter unknown species (12), and Campylobacter § STEC serogroups O157 (21 outbreaks), O26 (4), O103 (2), O111 (1), O145 (1), O121 (1), O45 (1), multiple serogroups (1), and unknown serogroup (2).(6 outbreaks). ** he denominator for the individual etiology percentages is the single etiology total. The denominator for the single etiology, multiple etiologies, and unknown etiology is the total of all outbreaks. Because of rounding, numbers might not add up to the single etiology total or the total of all outbreaks.††An etiologic agent was not conrmed or suspected based on clinical, laboratory, or epidemiologic information. 4 outbreaks. Finally, CDC’s outbreak surveillance system is dynamic. Agencies can submit new reports and change or delete reports as information becomes available. Therefore, the results of this analysis might dier from those in other reports.Additional InformationPublic health, regulatory, and food industry professionals can use this information to target prevention eorts aimed at pathogens and foods that cause the most outbreaks. Learn more about how outbreaks are r

eported and tracked at http://www.cdc.gov/foodsafety/fdoss/ References 1. Scallan E, Hoekstra RM, Angulo FJ, et al. Foodborne illness acquired in the United States—major pathogens. Emerging Infectious Diseases 2011; 17(1): 7–15. 2. CDC. Guide to conrming a diagnosis in foodborne disease. Available at: http://www.cdc.gov/foodsafety/outbreaks/investigating-outbreaks/conrming_diagnosis.html. Accessed October 13, 2016. 3. Interagency Food Safety Analytics Collaboration (IFSAC): Completed Projects. Available at: http://http://www.cdc.gov/foodsafety/ifsac/projects/completed.html. Accessed October 13, 2016.Figure: Rate of reported foodborne disease outbreaks per 1 million population* and number of outbreaks, by stateand conrmed and suspected etiology—Foodborne Disease Outbreak Surveillance System, United States, 2015. 3 for the most hospitalizations in outbreaks with a single conrmed etiologic agent were Salmonella in seeded vegetables (225 hospitalizations), Salmonellain pork (70), and Staphylococcus aureus enterotoxin in chicken (31). Deaths were reported for the following pathogen-food category pairs: Salmonella in seeded vegetables (6 deaths), Clostridium botulinum in root and underground vegetables (2); Clostridium perfringens in beef, Listeria monocytogenes in vegetable row crops, Salmonella in pork, Salmonellain sprouts, and Vibrio vulnicusLocation of Food PreparationAmong the 779 outbreaks and 12,054 illnesses with a reported single location where food was prepared, 469 outbreaks (60%) and 4,757 associated illnesses (39%) were attributed to foods prepared in a restaurant (Table 3a, Table 3b, and Table 3c). Among these outbreaks, sit-down dining-style was the type of restaurant most commonly reported as the location where food was prepared (373 outbreaks, 48%). RecallsTwenty outbreaks resulted in product recalls. The foods recalled in outbreaks in which exposure occurred in one state were apple cider, bread, chicken, drink mix, ground beef, muns, pork, raw tuna, roast beef, and unpasteurized milk (1 each). Alfalfa seeds and sprouts, celery, chicken, cucumber, our, lettuce, moringa leaf powder, pork, raw tuna, and sprouted nut butter (1 each) were recalled in multistate outbreaks.Multistate OutbreaksThirty multistate outbreaks (3% of all outbreaks) were reported (Table 4), resulting in 1,947 illnesses (12% of illnesses), 411 (42% of hospitalizations), and 7 deaths (50% of deaths). Outbreaks involved a median of 7.5 states (range: 2–40). Seventeen outbreaks were caused by Salmonella; the serotypes were Newport (3 outbreaks); multiple serotypes (3); Enteritidis (2); Paratyphi B (2); Bareilly, Braenderup, Hartford, Java, Javiana, Poona, and Virchow (1 each). Ten multistate outbreaks were caused by STEC (serogroups O157 [4 outbreaks], O103 [2], O26 [2], O145 [1], and multiple serogroups [1]). One outbreak was caused by Cyclospora cayetanensis, one by Listeria, and one by Vibrio parahaemolyticus.The foods implicated or suspected as sources for multistate Salmonella outbreaks were tomatoes (2 outbreaks), tuna sushi (1 conrmed, 1 suspected), alfalfa seeds and sprouts, chicken, cucumber, Latin-style soft cheese (suspected), moringa leaf powder, pork, raw oysters (suspected), raw tuna, sprouted nut butter, sushi (suspected), true oil puree, and an unidentied food (1 each). For STEC, implicated foods were celery and onion (serogroup O157), our (O26 and O121), pizza dough mix (suspected) (O157), pre-packaged leafy greens (suspected) (O145), pre-packaged salad (suspected) (O157), romaine lettuce (suspected) (O157), and unidentied foods (serogroups O103 [2 outbreaks] and O26 [2 outbreaks]). The food implicated in the Cyclospora cayetanensis multistate outbreak was cilantro. Raw clams and raw oysters were implicated in the Vibrio parahaemolyticus outbreak, and contaminated lettuce was implicated in the Listeria outbreak.Multistate Outbreaks Spanning Multiple YearsFour multistate outbreaks investigated in 2015 are not included in the 2015 tally because the rst outbreak-associated illness occurred before 2015. Three were caused by Listeria; the implicated foods were ice cream (rst illness in 2010), caramel apples (rst illness in 2014), and cheese made with pasteurized milk (rst illness in 2014). One was caused by Salmonella; the implicated food was cashews (rst illness in 2014).LimitationsThe ndings in this report have at least three limitations. First, only a small proportion of foodborne illnesses that occur each year are identied as being associated with outbreaks. The extent to which the distribution of food vehicles and locations of preparation implicated in outbreaks reect the same vehicles and locations as sporadic foodborne illnesses is unknown. Similarly, not all outbreaks are identied, investigated, or reported. Second, many outbreaks had an unknown etiology, an unknown food vehicle, or both, and conclusions drawn from outbreaks with a conrmed etiology or food vehicle might not apply to other 2 in which exposure to the implicated food occurred in more than one state or territory. Population-based outbreak reporting rates were calculated for each state using U.S. Census estimates of the 2015 state populations (http://www.census.gov/popest). Multistate outbreaks were included in state population-based outbreak reporting rates by assigning one outbreak to each state that reported a case in the outbreak. Implicated foods were classied into 1 of 24 single-food categories if a single contaminated ingredient was identied or if all ingredients belonged to that category. Outbreaks attributed to foods that could not be assigned to one of these categories, or for which the report contained insucient information for category assignment, were not attributed to any category.FindingsStates and RatesDuring 2015, there were 902 foodborne disease outbreaks reported (Table 1), resulting in 15,202 illnesses, 950 hospitalizations, and 15 deaths. Outbreaks were reported by public health ocials from 50 states, Puerto Rico, and Washington D. C. (Figure). The median rate per million population was 3.5 outbreaks; rates ranged from 0.6 in Mississippi to 14.1 in Kansas.Etiologic AgentsA single etiologic agent was conrmed in 443 (49%) outbreaks (Table 1), which resulted in 10,008 (66%) illnesses. Bacteria caused the most outbreaks (238 outbreaks, 54%), followed by viruses (168, 38%), chemicals (33, 7%), and parasites (4, 1%). Norovirus was the most common cause of conrmed, single-etiology outbreaks, accounting for 164 (37%) outbreaks and 3,893 (39%) illnesses. Salmonella was the next most common cause, accounting for 149 (34%) outbreaks and 3,944 (39%) illnesses. Among the 146 conrmed Salmonella outbreaks with a serotype reported, Enteritidis was the most common (51 outbreaks, 35%), followed by I 4,[5],12:i:- (15, 10%), Newport (8, 6%), and Braenderup (7, 5%). Shiga toxin-producing Escherichia coli (STEC) caused 27 conrmed, single-etiology outbreaks, of which 17 (63%) were caused by serogroup O157, 3 (11%) by O26, 2 (7%) by O103, 1 (4%) by O45, 1 (4%) by O111, 1 (4%) by O121, 1 (4%) by O145, and 1 (4%) by multiple serogroups. Illnesses, Hospitalizations, and DeathsOf the 10,008 outbreak-associated illnesses caused by a single conrmed etiologic agent, 896 (9%) resulted in hospitalization (Table 1). Among conrmed, single-etiology outbreaks, Salmonella caused the most outbreak-associated hospitalizations (573 hospitalizations, 64%), followed by STEC (1

06, 12%) (53, 6%). Outbreaks caused by Clostridium botulinum resulted in the highest proportion of ill persons hospitalized (97%), followed by Listeria monocytogenes (90%) and Hepatitis A virus (38%). Among the 15 deaths reported, 14 (93%) were attributed to bacterial etiologies (Salmonella [9], Clostridium botulinumumen-US&#x/Lan;&#xg 00;&#x/Lan;&#xg 00;Clostridium perfringensfringensen-US&#x/Lan;&#xg 00;&#x/Lan;&#xg 00;Listeria monocytogenesogenesen-US&#x/Lan;&#xg 00;&#x/Lan;&#xg 00;Vibrio vulnicus[1]). One death was attributed to norovirus.Food Categories ImplicatedA food was reported for 360 (40%) outbreaks. In 194 (54%) of these outbreaks, the food could be classied into 1 of the 24 categories (Table 2a); the categories most commonly implicated were sh (34 outbreaks, 18%), chicken (22, 11%), pork (19, 10%), and dairy (18, 9%). Pasteurization information was reported for 14 of the dairy outbreaks and 13 (93%) of these involved unpasteurized products. The most outbreak-associated illnesses were from seeded vegetables (e.g., cucumbers or tomatoes, 1,121 illnesses), pork (924), vegetable row crops (e.g., leafy vegetables, 383), and chicken (333).Etiologic Agents and Food Category Pairs The pathogen-food category pairs responsible for most outbreaks with a single conrmed etiologic agent were ciguatoxin in sh (20 outbreaks), scombroid toxin Salmonella in chicken (9) (Table 2b). The pathogen-food category pairs responsible for the most illnesses in outbreaks with a single conrmed etiologic agent were Salmonellain seeded vegetables (1,048 illnesses), Salmonella in pork (615), and Salmonella in vegetable row crops (263). The pathogen-food category pairs responsible For more information, please contact:Centers for Disease Control and Prevention1600 Clifton Road NE, Atlanta, GA 30333Telephone: 1-800-CDC-INFO (232-4636) / TTY: 1-888-232-6348cdcinfo@cdc.govWeb: http://www.cdc.gov CS275193-A 19 Appendix: Reported foodborne disease outbreaks, by conrmed and suspected etiology* and contributing factors—Foodborne Disease Outbreak Surveillance System, United States, 2015 * f at least one etiology was laboratory-conrmed, the outbreak was considered to have a conrmed etiology. If no etiology was laboratory-conrmed but an etiology was reported based on clinical or epidemiologic features, the outbreak was considered to have a suspected etiology.. † Contributing factors are dened as risk factors that either enable an outbreak to occur or amplify an outbreak caused by other means. Contributing factors are classied into three categories: contamination factors (factors that introduce or otherwise permit contamination), proliferation/amplication factors (factors that allow proliferation or growth of the etiologic agent), and survival factors (factors that allow survival or fail to inactivate a contaminant). More than one contributing factor might be reported per outbreak.Contributing factors:C1: toxic substance part of the tissueC2: poisonous substance intentionally/deliberately addedC3: poisonous substance accidentally/inadvertently addedC4: addition of excessive quantities of ingredients that are toxic in large amountsC5: toxic containerC6: contaminated raw product—food that was intended to be consumed after a kill stepC7: contaminated raw product—food was intended to be consumed raw or undercooked/underprocessedC8: foods originating from sources shown to be contaminated or polluted (such as a growing eld or harvest area)C9: cross-contamination of ingredients (cross-contamination does not include ill food workers)C10: bare-handed contact by a food handler/worker/preparer who is suspected to be infectiousC11: glove-handed contact by a food handler/worker/preparer who is suspected to be infectiousC12: other mode of contamination (excluding cross-contamination) by a food handler/worker/preparer who is suspected to be infectiousC13: foods contaminated by non-food handler/worker/preparer who is suspected to be infectiousC14: storage in a contaminated environmentC15: other source of contaminationP1: food preparation practices that support proliferation of pathogens (during food preparation)P2: no attempt was made to control the temperature of implicated food or the length of time food was out of temperature control (during food service or display of food)P3: improper adherence of approved plan to use Time as a Public Health ControlP4: improper cold holding due to malfunctioning refrigeration equipmentP5: improper cold holding due to an improper procedure or protocolP6: improper hot holding due to malfunctioning equipmentP7: improper hot holding due to improper procedure or protocolP8: improper/slow coolingP9: prolonged cold storageP10: inadequate modied atmospheric packagingP11: inadequate processing (acidication, water activity, fermentation)P12: other situations that promoted or allowed microbial growth or toxin productionS1: insucient time and/or temperature control during initial cooking/heat processingS2: insucient time and/or temperature during reheatingS3: insucient time and/or temperature control during freezingS4: insucient or improper use of chemical processes designed for pathogen destructionS5: other process failures that permit pathogen survivalNo outbreaks in the data reported fall in this category.An etiologic agent was not conrmed or suspected based on clinical, laboratory, or epidemiologic information. 18 Appendix Table 6: Foodborne disease outbreaks by suspected etiology* and contributing factors—Foodborne Disease Outbreak Surveillance System, United States, 2015. Survival FactorsNo. outbreaks with reported contributing factorsTotal No. outbreaksEtiology1 factor reportedBacterialSalmonellaClostridium perfringensEscherichia coli, Shiga toxin-producingCampylobacterStaphylococcus aureus enterotoxinBacillus cereusVibrio parahaemolyticusStaphylococcus sppClostridium botulinumListeria monocytogenesVibrio vulnicusStreptococcus, Group A Escherichia coli, EnteropathogenicYersinia enterocoliticaOtherSubtotalChemical and toxinCiguatoxinScombroid toxin / HistaminePuer sh tetrodotoxinOtherSubtotalParasiticCryptosporidiumTrichinellaCyclosporaSubtotalViralNorovirus147Hepatitis A virusSapovirusSubtotal14892232Unknown etiology 209Total149451Appendices’ footnotes are on page 19. 17 Appendix Table 5: Foodborne disease outbreaks by suspected etiology* and contributing factors—Foodborne Disease Outbreak Surveillance System, United States, 2015. Proliferation / Amplication FactorsNo. outbreaks with reported contributing factorsTotal No. outbreaksEtiology1 factor reportedBacterialSalmonellaClostridium perfringensEscherichia coli, Shiga toxin-producingCampylobacterStaphylococcus aureus enterotoxinBacillus cereusVibrio parahaemolyticus Staphylococcus sppClostridium botulinumListeria monocytogenesVibrio vulnicusStreptococcus, Group AEscherichia coli, EnteropathogenicYersinia enterocoliticaOther SubtotalChemical and toxinCiguatoxinScombroid toxin / HistaminePuer sh tetrodotoxinOtherSubtotalParasiticCryptosporidiumTrichinellaCyclosporaSubtotalViral 147NorovirusHepatitis A virusSapovirus148Subtotal92232209Unknown etiology149451Total 156398Appendices’ footnotes are on page 19. 16 Appendix Table 4: Foodborne disease outbreaks by suspected etiology* and contributing factors—Foodborne Disease Outbreak Surveillance System, United States, 2015. Contamination FactorsNo. outbreaks with reported contributing factorsTotal No.

outbreaksEtiology1 factor reportedBacterialSalmonellaClostridium perfringensEscherichia coli, Shiga toxin-producingCampylobacterStaphylococcus aureus enterotoxinBacillus cereus Vibrio parahaemolyticusStaphylococcus Clostridium botulinumListeria monocytogenesVibrio vulnicusStreptococcus, Group A Escherichia coli, EnteropathogenicYersinia enterocoliticaOtherSubtotalChemical and toxinCiguatoxinScombroid toxin / HistaminePuer sh tetrodotoxinOtherSubtotalParasiticCryptosporidiumTrichinellaCyclospora SubtotalViralNorovirus147Hepatitis A virusSapovirusSubtotal14892232 Unknown etiology209Total115149451Appendices’ footnotes are on page 19. 15 Appendix Table 3: Foodborne disease outbreaks by conrmed etiology* and contributing factors—Foodborne Disease Outbreak Surveillance System, United States, 2015. Survival FactorsNo. outbreaks with reported contributing factorsTotal No. outbreaksEtiology1 factor reportedBacterialSalmonella149Clostridium perfringensEscherichia coli, Shiga toxin-producingCampylobacterStaphylococcus aureus enterotoxinBacillus cereusVibrio parahaemolyticusStaphylococcus Clostridium botulinumListeria monocytogenesVibrio vulnicusStreptococcus, Group A Escherichia coli, EnteropathogenicYersinia enterocoliticaOtherSubtotal124238Chemical and toxinCiguatoxinScombroid toxin / HistaminePuer sh tetrodotoxinOtherSubtotalParasiticCryptosporidiumTrichinellaCyclosporaSubtotalViralNorovirus164Hepatitis A virusSapovirusSubtotal168243443Total 248451Appendices’ footnotes are on page 19. 14 Appendix Table 2: Foodborne disease outbreaks by conrmed etiology* and contributing factors—Foodborne Disease Outbreak Surveillance System, United States, 2015. Proliferation / Amplication FactorsNo. outbreaks with reported contributing factorsTotal No. outbreaksEtiology1 factor reportedBacterialSalmonella149Clostridium perfringensEscherichia coli, Shiga toxin-producingCampylobacterStaphylococcus aureus enterotoxinBacillus cereusVibrio parahaemolyticus Staphylococcus Clostridium botulinumListeria monocytogenesVibrio vulnicusStreptococcus, Group AEscherichia coli, EnteropathogenicYersinia enterocolitica OtherSubtotal124238Chemical and toxinCiguatoxinScombroid toxin / HistaminePuer sh tetrodotoxinOtherSubtotalParasiticCryptosporidiumTrichinellaCyclosporaSubtotalViralNorovirus 164Hepatitis A virusSapovirusSubtotal168243443Total248451Appendices’ footnotes are on page 19. 13 Appendix Table 1: Foodborne disease outbreaks by conrmed etiology* and contributing factors—Foodborne Disease Outbreak Surveillance System, United States, 2015. Contamination FactorsNo. outbreaks with reported contributing factorsTotal No. outbreaksEtiology1 factor reportedBacterialSalmonella149Clostridium perfringensEscherichia coli, Shiga toxin-producingCampylobacterStaphylococcus aureus enterotoxinBacillus cereus Vibrio parahaemolyticusStaphylococcus Clostridium botulinumListeria monocytogenesVibrio vulnicusStreptococcus, Group A Escherichia coli, EnteropathogenicYersinia enterocoliticaOtherSubtotal124238Chemical and toxinCiguatoxinScombroid toxin / HistaminePuer sh tetrodotoxinOtherSubtotal29ParasiticCryptosporidiumTrichinellaCyclospora SubtotalViralNorovirus164Hepatitis A virusSapovirusSubtotal1682929214243443 Total2929219248451Appendices’ footnotes are on page 19. 12 Table 4: Multistate foodborne disease outbreaks, United States, 2015. Implicated food*Month of rst Etiology No. No. hospitalizationsNo. deathsNo. states involvedConrmedRecallMarchSalmonella serotypeParatyphi BLettuceYesMarchSalmonella serotypes Weltevreden and Paratyphi BRaw tunaYesYesMarchShiga toxin-producing E. coli O103No food reportedMarchSalmonella serotype NewportLatin-style soft cheeseMarchShiga toxin-producing E. coli O157:H7Romaine lettuceAprilSalmonella serotype EnteritidisChickenYesYesAprilShiga toxin-producing E. coli O145Prepackaged leafy greensAprilSalmonella serotypes Infantis and I 4,[5],12:i:-192PorkYesYesMaySalmonella serotype HartfordTomatoesMayCyclospora cayetanensisCilantroMaySalmonella serotype Paratyphi BTuna sushi Vibrio parahaemolyticusRaw oysters; raw clamsYesListeria monocytogenesLettuceYesYesSalmonella serotype NewportRaw oystersSalmonella serotype Poona907204CucumberYesYesSalmonella serotype JavaSprouted nut butterYesYesSalmonella serotype JavianaNo food reportedAugustSalmonella serotype EnteritidisTruffle oil pureeYesAugustSalmonella serotype BareillyTuna sushiYesAugustSalmonella serotype Newport119TomatoYesSeptemberSalmonella serotype BraenderupSushiOctoberhiga toxin-producing E. coli O26No food reportedOctoberShiga toxin-producing E. coli O157:H7Pre-packaged saladOctoberShiga toxin-producing E. coli O103No food reportedOctoberShiga toxin-producing E. coli O157:H7Celery; onionYesYesNovemberShiga toxin-producing E. coli O26No food reportedDecemberSalmonella serotypes Kentucky, Cubana, and MuenchenAlfalfa sprouts; alfalfa sprout seedsYesYesDecemberShiga toxin-producing E. coli O26:NM and O121FlourYesYesDecemberSalmonella serotype VirchowMoringa leaf powderYesYesDecemberShiga toxin-producing E. coli O157:H7Pizza dough mix * mplicated foods in multistate outbreaks are further classied as conrmed or suspected based on epidemiologic, traceback, and laboratory evidence. A food is considered the conrmed source if two types of evidence are obtained, while a food is considered suspected if only one type of evidence is available. 11 Table 3c: Foodborne disease outbreaks and outbreak-associated illnesses, by suspected* etiology and location of food preparation—Foodborne Disease Outbreak Surveillance System, United State, 2015. Catering or facilityRestaurantOther commercial locationInstitutional locationPrivate Other private locationOther locationEtiologyBacterialSalmonellaClostridium perfringens150Escherichia coli, Shiga toxin-producingCampylobacterStaphylococcus aureus enterotoxinBacillus cereus Vibrio parahaemolyticusStaphylococcus sppClostridium botulinumListeria monocytogenesVibrio vulnicusStreptococcus, Group AEscherichia coli, EnteropathogenicYersinia enterocoliticaOtherSubtotal239209107Chemical and toxinCiguatoxinScombroid toxin / HistaminePuer sh tetrodotoxinOtherSubtotalParasiticCryptosporidiumTrichinellaCyclosporaSubtotal ViralNorovirus471106648229Hepatitis A virusSapovirusSubtotal471107651229710144863342130Unknown etiology825118570144192Total15802671469229 534207Abbreviations: NO = number of outbreaks; NI = number of illnesses. * f at least one etiology was conrmed based on dened criteria ( http://www.cdc.gov/foodsafety/outbreaks/investigating-outbreaks/conrming_diagnosis.html), the outbreak was considered to have a conrmed etiology. If an etiology was reported but not conrmed, the outbreak was considered to have a suspected etiology. eported locations were grouped as follows: catering or banquet facility, restaurant, other commorcial location, hospital or nursing home, other institutional location, private home, other private location, and other location (includes Hotal or motel and Ship or boat) (see Table 3a). No outbreaks in the data reported fall into this category. An etiologic agent was not conrmed or suspected based on clinical, laboratory, or epidemiologic information. 10 Table 3b: Foodborne disease outbreaks and outbreak-associated illnesses, by conrmed* etiology and location of food preparation—Foodborne Disease Outbreak Surveillance System, United State, 2015. Catering or facilityR

estaurantOther commercial locationInstitutional locationPrivate Other private locationOther locationEtiologyBacterialSalmonella1911102402282259Clostridium perfringens92221120Escherichia coli, Shiga toxin-producing120Campylobacter29Staphylococcus aureus enterotoxin144Bacillus cereus Vibrio parahaemolyticus226Staphylococcus sppClostridium botulinumListeria monocytogenesVibrio vulnicusStreptococcus, Group AEscherichia coli, EnteropathogenicYersinia enterocoliticaOtherSubtotal3261607493721500Chemical and toxinCiguatoxinScombroid toxin / HistaminePuer sh tetrodotoxinOtherSubtotal43ParasiticCryptosporidium103TrichinellaCyclosporaSubtotal103 ViralNorovirus964148913749911029143Hepatitis A virusSapovirusSubtotal96414981374991102914312901993238744122023150178Total130020232887891398231Abbreviations: NO = number of outbreaks; NI = number of illnesses. * f at least one etiology was conrmed based on dened criteria ( http://www.cdc.gov/foodsafety/outbreaks/investigating-outbreaks/conrming_diagnosis.html), the outbreak was considered to have a conrmed etiology. If an etiology was reported but not conrmed, the outbreak was considered to have a suspected etiology. eported locations were grouped as follows: catering or banquet facility, restaurant, other commorcial location, hospital or nursing home, other institutional location, private home, other private location, and other location (includes Hotel or motel and Ship or boat) (see Table 3a). No outbreaks in the data reported fall into this category. 9 Table 3a: Foodborne disease outbreaks and outbreak-associated illnesses, by location of food preparation—Foodborne Disease Outbreak Surveillance System, United States, 2015. No. OutbreaksNo. IllnessesLocationTotalTotalRestaurant4694757Sit-down dining3733632Fast-food651BuetOther or unknown type303Multiple types171Catering or banquet facility1122880Private home873Institutional location1932School622Prison or jail988Camp104Day CareOce or indoor workplaceOtherOther location239Other commercial location855Grocery store572Fair, festival, or temporary mobile service104Farm or dairy140Other328313Other private locationPlace of worship Other50Hotel or motelShip or boatSingle location*77912054Multiple locations1552Unknown location1596Total90210015202100 * he denominator for the location percentages is the single location total. The denominator for the single location, multiple locations, and unknown location is the total. Because of rounding, numbers might not add up to the single location total or the total. 8 Table 2b: Most common conrmed pathogen-food category pairs resulting in outbreaks, outbreak-associated illnesses, hospitalizations, and deaths—Foodborne Disease Outbreak Surveillance System, United States, 2015. Top 5 pathogen-food category pairs resulting in outbreaksEtiologyFood Category*No. OutbreaksNo. IllnessesNo. HospitalizationsNo. DeathsCiguatoxinFishScombroid toxin / HistamineFishSalmonellaChickenSalmonellaPork615CampylobacterDairy Top 5 pathogen-food category pairs resulting in outbreak-associated illnessesEtiologyFood Category*No. OutbreaksNo. IllnessesNo. HospitalizationsNo. DeathsSalmonellaSeeded vegetables1048225SalmonellaPork615SalmonellaVegetable row crops263NorovirusOther225Clostridium perfringensPork217 Top 5 pathogen-food category pairs resulting in outbreak-associated hospitalizationsEtiologyFood Category*No. OutbreaksNo. IllnessesNo. HospitalizationsNo. DeathsSalmonellaSeeded vegetables1048225SalmonellaPork615Staphylococcus aureus enterotoxinChicken102Clostridium botulinumRoot and other underground vegetablesEscherichia coli, Shiga toxin-producingGrains and beans Pathogen-food category pairs resulting in outbreak-associated deathsEtiologyFood Category*No. OutbreaksNo. IllnessesNo. HospitalizationsNo. DeathsSalmonellaSeeded Vegetables1048225Clostridium botulinumRoot and other underground vegetablesSalmonellaPork615Clostridium perfringensBeef134SalmonellaSproutsListeria monocytogenesVegetable row cropsVibrio vulnicusMollusks* Interagency Food Safety Analytics Collaboration (IFSAC) food categorization scheme: http://www.cdc.gov/foodsafety/ifsac/projects/completed.html 7 Table 2a: Foodborne disease outbreaks and outbreak-associated illnesses, by food category*—Foodborne Disease Outbreak Surveillance System, United States, 2015. No. OutbreaksNo. IllnessesFood Category*TotalTotalAquatic animalsCrustaceans164Fish176Other aquatic animalsSubtotal359Dairy116EggsBeef225Pork924ChickenTurkey137Other poultryGameSubtotal1819PlantsSproutsRoot and other underground vegetablesSeeded vegetables¶1121132Vegetable row crops**383FruitsGrains and beansSubtotal1939Other 247Food reported, attributed to a single food category194436429Food reported with ingredients that belong t�o 1 food category1662889No food reported542794952Total90210015202100* Interagency Food Safety Analytics Collaboration (IFSAC) food categorization scheme: http://www.cdc.gov/foodsafety/ifsac/projects/completed.html Bivalve mollusks (16 outbreaks). Unpasteurized dairy products (13 outbreaks), pasteurization unknown (4), and pasteurized dairy products (1). Roots (2 outbreaks) and tubers (2). Solanaceous seeded vegetables (3 outbreaks), vine-grown seeded vegetables (3), legumes (1), and other seeded vegetables (1).** Leafy vegetables (10 outbreaks). Pome fruits (4 outbreaks) and fruits not further classied (2). Grains (6 outbreaks) and beans (1). Nuts (1 outbreak). he denominator for the food category percentages is the "food reported, attributed to a single food category" total. The denominator for the "food reported attributed to a single food category", "food reported, not attributed to a single food category", and "No food reported" is the total. Because of rounding, numbers might not add up to the ”food reported, attributed to a single food category“ total or the total. Surveillance for Foodborne Disease Outbreaks, United States2015 | Annual Report Surveillance for Foodborne Disease Outbreaks, United States2015 | Annual Report Surveillance for Foodborne Disease Outbreaks, United States2015 | Annual Report ContentsMain FindingsBackgroundFindingsLimitationsAdditional InformationReferences...........................................................................................................................................................................................Figure: Rate of reported foodborne disease outbreaks per 1 million population and number of outbreaks by state and etiology .................................................................................................................................................Table 1: Foodborne disease outbreaks, outbreak-associated illnesses, and hospitalizations, by etiologyTable 2a: Foodborne disease outbreaks and outbreak-associated illnesses, by food categoryTable 2b: Most common conrmed pathogen-food category pairs resulting in outbreaks and associated illnesses, hospitalizations, and deathsTable 3a: Foodborne disease outbreaks and associated illnesses, by location offood preparationTable 3b: Foodborne disease outbreaks and associated illnesses, by conrmed etiology and location of food preparationTable 3c: Foodborne disease outbreaks and associated illnesses, by suspected etiology and location of food preparationTable 4: Multistate foodborne disease outbreaksAppendix: Foodborne disease outbreaks by etiology and contributing factors 1 Main FindingsIn 2015, there were 902 foodborne disease outbreaks reported, resulting in 15,202 illnesses, 950 hosp

italizations, 15 deaths, and 20 food product recalls.Norovirus was the most common cause of conrmed, single-etiology outbreaks, accounting for 164 (37%) outbreaks and 3,893 (39%) illnesses. Salmonella was the next most common cause, accounting for 149 (34%) outbreaks and 3,944 (39%) illnesses, followed by Shiga toxin-producing Escherichia coli, which caused 27 (6%) conrmed single-etiology outbreaks and 302 (3%) illnesses.Fish (34 outbreaks), chicken (22), and pork (19) were the most common single food categories implicated. The most outbreak-associated illnesses were from seeded vegetables (e.g., cucumbers or tomatoes, 1,121 illnesses), pork (924), and vegetable row crops (e.g., leafy vegetables, 383).As reported in previous years, restaurants (469 outbreaks, 60% of outbreaks reporting a single location of preparation), specically restaurants with sit-down dining (373, 48%), were the most commonly reported locations of food preparation associated with outbreaks. BackgroundFoodborne diseases due to known pathogens are estimated to cause 9.4 million illnesses each year in the United States. Although relatively few of these illnesses occur in the setting of a recognized outbreak, data collected during outbreak investigations provide insight into the pathogens and foods that cause illness. Public health ocials, regulatory agencies, and the food industry can use these data to create control strategies along the farm-to-table continuum that target specic pathogens and foods. An outbreak of foodborne disease is dened as the occurrence of two or more cases of a similar illness resulting from ingestion of a common food.Foodborne disease outbreaks are a nationally notiable condition (http://c.ymcdn.com/sites/www.cste.org/resource/resmgr/CSTENotiableConditionListA.pdf). CDC conducts surveillance of foodborne disease outbreaks in the United States through the Foodborne Disease Outbreak Surveillance System. Public health agencies in all 50 states, the District of Columbia, and U.S. territories voluntarily submit reports of outbreaks investigated by their agencies using a Web-based reporting platform, the National Outbreak Reporting System (NORS) (http://www.cdc.gov/). NORS also collects reports of enteric disease outbreaks with other transmission modes, including water, animal contact, person-to-person contact, environmental contamination, and unidentied modes. Agencies use a standard form (https://www.cdc.gov/nors/downloads/form-52-13.pdf) to report foodborne disease outbreaks. Data requested for each outbreak include: the reporting state; date of rst illness onset; number of illnesses, hospitalizations, and deaths; etiology; implicated food(s) and ingredient(s); locations of food preparation; and factors contributing to food contamination (see appendix). The reporting form also allows for reporting the reason(s) a particular food is suspected as the source; ve choices are provided http://www.cdc.gov/nors/downloads/guidance.). All foods implicated are included in analyses, regardless of the reasons suspected. Implicated foods in multistate outbreaks are further classied as conrmed or suspected based on epidemiologic, traceback, and laboratory evidence. A food is considered the conrmed source if two types of evidence are obtained, while a food is considered suspected if only one type of evidence is available. Reports of outbreaks on cruise ships that dock in both U.S. and international ports and those in which the food was eaten outside the United States, even if the illness occurred in the United States, are excluded from the Foodborne Disease Outbreak Surveillance System.This report includes foodborne disease outbreaks reported by October 20, 2016, in which the rst illness onset occurred in 2015. Etiologic agents were reported as conrmed if predened criteria were met; otherwise, they were reported as suspected. In some outbreaks the etiologic agent is unknown. For outbreaks caused by a single conrmed or suspected etiology, etiologies were grouped as bacterial, chemical and toxin, parasitic, or viral. Multistate outbreaks were dened as outbreaks Surveillance for Foodborne Disease Outbreaks United States 2015 Annual Report AcknowledgementsThe ndings in this study are based, in part, on contributions by state, local, and territorial health departments. Suggested CitationCenters for Disease Control and Prevention (CDC). Surveillance for Foodborne Disease Outbreaks, United States, 2015, Annual Report. Atlanta, Georgia: US Department of Health and Human Services, CDC, 2017.Report compiled byDaniel Dewey-Mattia, Karunya Manikonda, Julia Chen, Hannah Kisselburgh, Caroline Pilewski, Preethi Sundararaman, and Samuel Crowe Centers for Disease Control and PreventionDivision of Foodborne, Waterborne, and Environmental Diseases1600 Clifton Road, Mail Stop C-09, Atlanta, GA 30329-4027Telephone: 404.639.2206NORS-Foodborne@cdc.govWeb: http://www.cdc.gov/foodsafety/fdoss/ Surveillance for Foodborne Disease Outbreaks United States, 2015: Annual Report 13 Appendix Table 1: Foodborne disease outbreaks by conrmed etiology* and contributing factors—Foodborne Disease Outbreak Surveillance System, United States, 2015. Contamination FactorsNo. outbreaks with reported contributing factorsTotal No. outbreaksEtiology1 factor reportedBacterialSalmonella149Clostridium perfringensEscherichia coli, Shiga toxin-producingCampylobacterStaphylococcus aureus enterotoxinBacillus cereus Vibrio parahaemolyticusStaphylococcus Clostridium botulinumListeria monocytogenesVibrio vulnicusStreptococcus, Group A Escherichia coli, EnteropathogenicYersinia enterocoliticaOtherSubtotal124238Chemical and toxinCiguatoxinScombroid toxinHistaminePuer sh tetrodotoxin OtherSubtotal29ParasiticCryptosporidiumTrichinellaCyclosporaSubtotalViralNorovirus 164Hepatitis A virusSapovirusSubtotal1682929214243443Total2929219248451Appendices’ footnotes are on page 19. For more information, please contact:Centers for Disease Control and Prevention1600 Clifton Road NE, Atlanta, GA 30333Telephone: 1-800-CDC-INFO (232-4636)TTY: 1-888-232-6348cdcinfo@cdc.govWeb: http://www.cdc.gov CS275193-A 19 Appendix: Reported foodborne disease outbreaks, by conrmed and suspected etiology* and contributing factors—Foodborne Disease Outbreak Surveillance System, United States, 2015* If at least one etiology was laboratory-conrmed, the outbreak was considered to have a conrmed etiology. If no etiology was laboratory-conrmed but an etiology was reported based on clinical or epidemiologic features, the outbreak was considered to have a suspected etiology.. Contributing factors are dened as risk factors that either enable an outbreak to occur or amplify an outbreak caused by other means. Contributing factors are classied into three categories: contamination factors (factors that introduce or otherwise permit contamination), proliferation/amplication factors (factors that allow proliferation or growth of the etiologic agent), and survival factors (factors that allow survival or fail to inactivate a contaminant). More than one contributing factor might be reported per outbreak.Contributing factors:C1: toxic substance part of the tissueC2: poisonous substance intentionally/deliberately addedC3: poisonous substance accidentally/inadvertently addedC4: addition of excessive quantities of ingredients that are toxic in large amountsC5: toxic containerC6: contaminated raw product—food that was intended to be consumed after a kill

stepC7: contaminated raw product—food was intended to be consumed raw or undercooked/underprocessedC8: foods originating from sources shown to be contaminated or polluted (such as a growing eld or harvest area)C9: cross-contamination of ingredients (cross-contamination does not include ill food workers)C10: bare-handed contact by a food handler/worker/preparer who is suspected to be infectiousC11: glove-handed contact by a food handler/worker/preparer who is suspected to be infectiousC12: other mode of contamination (excluding cross-contamination) by a food handler/worker/preparer who is suspected to be infectiousC13: foods contaminated by non-food handler/worker/preparer who is suspected to be infectiousC14: storage in a contaminated environmentC15: other source of contaminationP1: food preparation practices that support proliferation of pathogens (during food preparation)P2: no attempt was made to control the temperature of implicated food or the length of time food was out of temperature control (during food service or display of food)P3: improper adherence of approved plan to use Time as a Public Health ControlP4: improper cold holding due to malfunctioning refrigeration equipmentP5: improper cold holding due to an improper procedure or protocolP6: improper hot holding due to malfunctioning equipmentP7: improper hot holding due to improper procedure or protocolP8: improper/slow coolingP9: prolonged cold storageP10: inadequate modied atmospheric packagingP11: inadequate processing (acidication, water activity, fermentation)P12: other situations that promoted or allowed microbial growth or toxin productionS1: insucient time and/or temperature control during initial cooking/heat processingS2: insucient time and/or temperature during reheatingS3: insucient time and/or temperature control during freezingS4: insucient or improper use of chemical processes designed for pathogen destructionS5: other process failures that permit pathogen survivalNo outbreaks in the data reported fall in this category.An etiologic agent was not conrmed or suspected based on clinical, laboratory, or epidemiologic information. 18 Appendix Table 6: Foodborne disease outbreaks by suspected etiology* and contributing factors—Foodborne Disease Outbreak Surveillance System, United States, 2015. Survival FactorsNo. outbreaks with reported contributing factorsTotal No. outbreaksEtiology1 factor reportedBacterialSalmonellaClostridium perfringensEscherichia coli, Shiga toxin-producingCampylobacterStaphylococcus aureus enterotoxinBacillus cereusVibrio parahaemolyticusStaphylococcus sppClostridium botulinumListeria monocytogenesVibrio vulnicusStreptococcus, Group A Escherichia coli, EnteropathogenicYersinia enterocoliticaOtherSubtotalChemical and toxinCiguatoxinScombroid toxinHistaminePuer sh tetrodotoxinOtherSubtotalParasiticCryptosporidiumTrichinellaCyclosporaSubtotalViralNorovirus147Hepatitis A virus SapovirusSubtotal14892232Unknown etiology209Total149451Appendices’ footnotes are on page 19. 17 Appendix Table 5: Foodborne disease outbreaks by suspected etiology* and contributing factors—Foodborne Disease Outbreak Surveillance System, United States, 2015. ProliferationAmplication FactorsNo. outbreaks with reported contributing factorsTotal No. outbreaksEtiology1 factor reportedBacterialSalmonellaClostridium perfringensEscherichia coli, Shiga toxin-producingCampylobacterStaphylococcus aureus enterotoxinBacillus cereusVibrio parahaemolyticus Staphylococcus sppClostridium botulinumListeria monocytogenesVibrio vulnicusStreptococcus, Group AEscherichia coli, EnteropathogenicYersinia enterocoliticaOther SubtotalChemical and toxinCiguatoxinScombroid toxinHistaminePuer sh tetrodotoxinOtherSubtotalParasiticCryptosporidiumTrichinella CyclosporaSubtotalViral147NorovirusHepatitis A virusSapovirus148Subtotal92232 209Unknown etiology149451Total156398Appendices’ footnotes are on page 19. 16 Appendix Table 4: Foodborne disease outbreaks by suspected etiology* and contributing factors—Foodborne Disease Outbreak Surveillance System, United States, 2015. Contamination FactorsNo. outbreaks with reported contributing factorsTotal No. outbreaksEtiology1 factor reportedBacterialSalmonellaClostridium perfringensEscherichia coli, Shiga toxin-producingCampylobacterStaphylococcus aureus enterotoxinBacillus cereus Vibrio parahaemolyticusStaphylococcus Clostridium botulinumListeria monocytogenesVibrio vulnicusStreptococcus, Group A Escherichia coli, EnteropathogenicYersinia enterocoliticaOtherSubtotalChemical and toxinCiguatoxinScombroid toxinHistaminePuer sh tetrodotoxin OtherSubtotalParasiticCryptosporidiumTrichinellaCyclosporaSubtotalViralNorovirus 147Hepatitis A virusSapovirusSubtotal14892232Unknown etiology209Total115149451 Appendices’ footnotes are on page 19. 15 Appendix Table 3: Foodborne disease outbreaks by conrmed etiology* and contributing factors—Foodborne Disease Outbreak Surveillance System, United States, 2015. Survival FactorsNo. outbreaks with reported contributing factorsTotal No. outbreaksEtiology1 factor reportedBacterialSalmonella149Clostridium perfringensEscherichia coli, Shiga toxin-producingCampylobacterStaphylococcus aureus enterotoxinBacillus cereusVibrio parahaemolyticusStaphylococcus Clostridium botulinumListeria monocytogenesVibrio vulnicusStreptococcus, Group A Escherichia coli, EnteropathogenicYersinia enterocoliticaOtherSubtotal124238Chemical and toxinCiguatoxinScombroid toxinHistaminePuer sh tetrodotoxinOtherSubtotalParasiticCryptosporidiumTrichinellaCyclosporaSubtotalViralNorovirus164Hepatitis A virus SapovirusSubtotal168243443Total248451Appendices’ footnotes are on page 19. 14 Appendix Table 2: Foodborne disease outbreaks by conrmed etiology* and contributing factors—Foodborne Disease Outbreak Surveillance System, United States, 2015. ProliferationAmplication FactorsNo. outbreaks with reported contributing factorsTotal No. outbreaksEtiology1 factor reportedBacterialSalmonella149Clostridium perfringensEscherichia coli, Shiga toxin-producingCampylobacterStaphylococcus aureus enterotoxinBacillus cereusVibrio parahaemolyticus Staphylococcus Clostridium botulinumListeria monocytogenesVibrio vulnicusStreptococcus, Group AEscherichia coli, EnteropathogenicYersinia enterocoliticaOther Subtotal124238Chemical and toxinCiguatoxinScombroid toxinHistaminePuer sh tetrodotoxinOtherSubtotalParasiticCryptosporidiumTrichinella CyclosporaSubtotalViralNorovirus164Hepatitis A virusSapovirusSubtotal168243443Total 248451Appendices’ footnotes are on page 19. 12 Table 4: Multistate foodborne disease outbreaks, United States, 2015. Implicated food*Month of rst Etiology No. No. hospitalizationsNo. deathsNo. states involvedConrmedRecallMarchSalmonella serotypeParatyphi BLettuceYesMarchSalmonella serotypes Weltevreden and Paratyphi BRaw tunaYesYesMarchShiga toxin-producing E. coli O103No food reportedMarchSalmonella serotype NewportLatin-style soft cheeseMarchShiga toxin-producing E. coli O157:H7Romaine lettuceAprilSalmonella serotype EnteritidisChickenYesYesAprilShiga toxin-producing E. coli O145Prepackaged leafy greensAprilSalmonella serotypes Infantis and I 4,[5],12:i:-192PorkYesYesMaySalmonella serotype HartfordTomatoesMayCyclospora cayetanensisCilantroMaySalmonella serotype Paratyphi BTuna sushiVibrio parahaemolyticusRaw oysters; raw clamsYesListeria monocytogenesLettuceYesYesSalmonella serotype Newport Raw oystersSa

lmonella serotype Poona907204CucumberYesYesSalmonella serotype JavaSprouted nut butterYesYesSalmonella serotype JavianaNo food reportedAugustSalmonella serotype EnteritidisTruffle oil pureeYesAugustSalmonella serotype BareillyTuna sushiYesAugustSalmonella serotype Newport119TomatoYesSeptemberSalmonella serotype BraenderupSushiOctoberhiga toxin-producing E. coli O26No food reportedOctoberShiga toxin-producing E. coli O157:H7Pre-packaged saladOctoberShiga toxin-producing E. coli O103No food reportedOctoberShiga toxin-producing E. coli O157:H7Celery; onionYesYesNovemberShiga toxin-producing E. coli O26No food reportedDecemberSalmonella serotypes Kentucky, Cubana, and MuenchenAlfalfa sprouts; alfalfa sprout seedsYesYesDecemberShiga toxin-producing E. coli O26:NM and O121FlourYesYesDecemberSalmonella serotype Virchow Moringa leaf powderYesYesDecemberShiga toxin-producing E. coli O157:H7Pizza dough mix* Implicated foods in multistate outbreaks are further classied as conrmed or suspected based on epidemiologic, traceback, and laboratory evidence. A food is considered the conrmed source if two types of evidence are obtained, while a food is considered suspected if only one type of evidence is available. 11 Table 3c: Foodborne disease outbreaks and outbreak-associated illnesses, by suspected* etiology and location of food preparation—Foodborne Disease Outbreak Surveillance System, United State, 2015. Catering or facilityRestaurantOther commercial locationInstitutional locationPrivate Other private locationOther locationEtiologyBacterialSalmonellaClostridium perfringens150Escherichia coli, Shiga toxin-producingCampylobacterStaphylococcus aureus enterotoxinBacillus cereus Vibrio parahaemolyticusStaphylococcus sppClostridium botulinumListeria monocytogenesVibrio vulnicusStreptococcus, Group AEscherichia coli, Enteropathogenic Yersinia enterocoliticaOtherSubtotal239209107Chemical and toxinCiguatoxinScombroid toxinHistaminePuer sh tetrodotoxinOtherSubtotal ParasiticCryptosporidiumTrichinellaCyclosporaSubtotalViralNorovirus471106648229Hepatitis A virusSapovirusSubtotal 471107651229710144863342130Unknown etiology825118570144192Total15802671469229534207Abbreviations: NO = number of outbreaks; NI = number of illnesses.* If at least one etiology was conrmed based on dened criteria (http://www.cdc.gov/foodsafety/outbreaks/investigating-outbreaks/conrming_diagnosis.html), the outbreak was considered to have a conrmed etiology. If an etiology was reported but not conrmed, the outbreak was considered to have a suspected etiology. Reported locations were grouped as follows: catering or banquet facility, restaurant, other commorcial location, hospital or nursing home, other institutional location, private home, other private location, and other location (includes Hotal or motel and Ship or boat) (see Table 3a). No outbreaks in the data reported fall into this category. An etiologic agent was not conrmed or suspected based on clinical, laboratory, or epidemiologic information. 10 Table 3b: Foodborne disease outbreaks and outbreak-associated illnesses, by conrmed* etiology and location of food preparation—Foodborne Disease Outbreak Surveillance System, United State, 2015. Catering or facilityRestaurantOther commercial locationInstitutional locationPrivate Other private locationOther locationEtiologyBacterialSalmonella1911102402282259Clostridium perfringens92221120Escherichia coli, Shiga toxin-producing120Campylobacter29Staphylococcus aureus enterotoxin144Bacillus cereus Vibrio parahaemolyticus226Staphylococcus sppClostridium botulinumListeria monocytogenesVibrio vulnicusStreptococcus, Group AEscherichia coli, Enteropathogenic Yersinia enterocoliticaOtherSubtotal3261607493721500Chemical and toxinCiguatoxinScombroid toxinHistaminePuer sh tetrodotoxinOtherSubtotal43 ParasiticCryptosporidium103TrichinellaCyclosporaSubtotal103ViralNorovirus964148913749911029143Hepatitis A virusSapovirusSubtotal 96414981374991102914312901993238744122023150178Total130020232887891398231Abbreviations: NO = number of outbreaks; NI = number of illnesses.* If at least one etiology was conrmed based on dened criteria (http://www.cdc.gov/foodsafety/outbreaks/investigating-outbreaks/conrming_diagnosis.html), the outbreak was considered to have a conrmed etiology. If an etiology was reported but not conrmed, the outbreak was considered to have a suspected etiology. Reported locations were grouped as follows: catering or banquet facility, restaurant, other commorcial location, hospital or nursing home, other institutional location, private home, other private location, and other location (includes Hotel or motel and Ship or boat) (see Table 3a). No outbreaks in the data reported fall into this category. 9 Table 3a: Foodborne disease outbreaks and outbreak-associated illnesses, by location of food preparation—Foodborne Disease Outbreak Surveillance System, United States, 2015. No. OutbreaksNo. IllnessesLocationTotalTotalRestaurant4694757Sit-down dining3733632Fast-food651BuetOther or unknown type303Multiple types171Catering or banquet facility1122880Private home873Institutional location1932School622Prison or jail988Camp104Day CareOce or indoor workplaceOtherOther location239Other commercial location855Grocery store572Fair, festival, or temporary mobile service104Farm or dairy140Other328313Other private locationPlace of worship Other50Hotel or motelShip or boatSingle location*77912054Multiple locations1552Unknown location1596Total90210015202100* The denominator for the location percentages is the single location total. The denominator for the single location, multiple locations, and unknown location is the total. Because of rounding, numbers might not add up to the single location total or the total. 8 Table 2b: Most common conrmed pathogen-food category pairs resulting in outbreaks, outbreak-associated illnesses, hospitalizations, and deaths—Foodborne Disease Outbreak Surveillance System, United States, 2015. Top 5 pathogen-food category pairs resulting in outbreaksEtiologyFood Category*No. OutbreaksNo. IllnessesNo. HospitalizationsNo. DeathsCiguatoxinFishScombroid toxinHistamineFishSalmonellaChickenSalmonellaPork615CampylobacterDairy Top 5 pathogen-food category pairs resulting in outbreak-associated illnessesEtiologyFood Category*No. OutbreaksNo. IllnessesNo. HospitalizationsNo. DeathsSalmonellaSeeded vegetables1048225SalmonellaPork615SalmonellaVegetable row crops263NorovirusOther225Clostridium perfringensPork217 Top 5 pathogen-food category pairs resulting in outbreak-associated hospitalizationsEtiologyFood Category*No. OutbreaksNo. IllnessesNo. HospitalizationsNo. DeathsSalmonellaSeeded vegetables1048225SalmonellaPork615Staphylococcus aureus enterotoxinChicken102Clostridium botulinumRoot and other underground vegetablesEscherichia coli, Shiga toxin-producingGrains and beans Pathogen-food category pairs resulting in outbreak-associated deathsEtiologyFood Category*No. OutbreaksNo. IllnessesNo. HospitalizationsNo. DeathsSalmonellaSeeded Vegetables1048225Clostridium botulinumRoot and other underground vegetablesSalmonellaPork615Clostridium perfringensBeef134SalmonellaSproutsListeria monocytogenesVegetable row cropsVibrio vulnicusMollusks* Interagency Food Safety Analytics Collaboration (IFSAC) food categorization scheme: http://www.cdc.gov/foodsafety/ifsac/projects/completed.html 7 Table 2a: Foodborne disease outbreaks and outbreak-associated illnesses, by food category*—Foodborne Disease Outbrea

k Surveillance System, United States, 2015. No. OutbreaksNo. IllnessesFood Category*TotalTotalAquatic animalsCrustaceans164Fish176Other aquatic animalsSubtotal359Dairy116EggsBeef225Pork924ChickenTurkey137Other poultryGameSubtotal1819PlantsSproutsRoot and other underground vegetablesSeeded vegetables¶1121132Vegetable row crops**383FruitsGrains and beansSubtotal1939Other 247Food reported, attributed to a single food category194436429Food reported with ingredients that belong t�o 1 food category1662889No food reported542794952Total90210015202100* Interagency Food Safety Analytics Collaboration (IFSAC) food categorization scheme: http://www.cdc.gov/foodsafety/ifsac/projects/completed.html Bivalve mollusks (16 outbreaks). Unpasteurized dairy products (13 outbreaks), pasteurization unknown (4), and pasteurized dairy products (1). Roots (2 outbreaks) and tubers (2). Solanaceous seeded vegetables (3 outbreaks), vine-grown seeded vegetables (3), legumes (1), and other seeded vegetables (1).** Leafy vegetables (10 outbreaks). Pome fruits (4 outbreaks) and fruits not further classied (2). Grains (6 outbreaks) and beans (1). Nuts (1 outbreak). The denominator for the food category percentages is the "food reported, attributed to a single food category" total. The denominator for the "food reported attributed to a single food category", "food reported, not attributed to a single food category", and "No food reported" is the total. Because of rounding, numbers might not add up to the ”food reported, attributed to a single food category“ total or the total. 6 Table 1: Foodborne disease outbreaks, outbreak-associated illnesses, and hospitalizations, by etiology (conrmed or suspected)* — Foodborne Disease Outbreak Surveillance System, United States, 2015. No. OutbreaksNo. IllnessesNo. HospitalizationsEtiologyTotalTotalTotalBacterialSalmonella14915839444035573574Clostridium perfringens6863421028Escherichia coli, Shiga toxin-producing (STEC)302350106115Campylobacter212258Staphylococcus aureus enterotoxin236291Bacillus cereusVibrio parahaemolyticus234242Staphylococcus spp Clostridium botulinumListeria monocytogenesVibrio vulnicusStreptococcus, Group AEscherichia coli, EnteropathogenicYersinia enterocoliticaOtherSubtotal2383165782715649752834849Chemical and toxinCiguatoxinScombroid toxinHistamine Puer sh tetrodotoxinOtherSubtotal115139ParasiticCryptosporidium105105TrichinellaCyclosporaSubtotal201201ViralNorovirus164147311389316525545Hepatitis A virusSapovirusSubtotal168 148316391016555565684432326751000823941240289692898283184467Unknown etiology209209233323332333Total4514519021001033548671520210090743950100Abbreviations: CE = conrmed etiology; SE = suspected etiology.* If at least one etiology was conrmed based on dened criteria (http://www.cdc.gov/foodsafety/outbreaks/investigating-outbreaks/conrming_diagnosis.html), the outbreak was considered to have a conrmed etiology. If an etiology was reported but not conrmed, the outbreak was considered to have a suspected etiology.Salmonella serotypes causing more than ve outbreaks were Enteritidis (53 outbreaks), I 4,[5],12:i:- (17), Newport (8), Braenderup (7), and Typhimurium (6).Campylobacter jejuni (20 outbreaks), Campylobacter unknown species (12), and Campylobacter § STEC serogroups O157 (21 outbreaks), O26 (4), O103 (2), O111 (1), O145 (1), O121 (1), O45 (1), multiple serogroups (1), and unknown serogroup (2).(6 outbreaks).** The denominator for the individual etiology percentages is the single etiology total. The denominator for the single etiology, multiple etiologies, and unknown etiology is the total of all outbreaks. Because of rounding, numbers might not add up to the single etiology total or the total of all outbreaks.††An etiologic agent was not conrmed or suspected based on clinical, laboratory, or epidemiologic information. 5 1 * Cut points for outbreak rate categories determined using quartiles. Legend diers for each map. Reported outbreaks in each state. Puerto Rico reported 2 outbreaks and Washington D. C. reported 3 outbreaks (not shown). Includes 30 multistate outbreaks (i.e., outbreaks in which exposure occurred in more than one state) assigned as an outbreak to each state involved. Multistate outbreaks involved a median of 7.5 states (range: 2–40). If at least one etiology was conrmed based on dened criteria (http://www.cdc.gov/foodsafety/outbreaks/investigating-outbreaks/conrming_diagnosis.html), the outbreak was considered to have a conrmed etiology. If an etiology was reported but not conrmed, the outbreak was considered to have a suspected etiology. 4 outbreaks. Finally, CDC’s outbreak surveillance system is dynamic. Agencies can submit new reports and change or delete reports as information becomes available. Therefore, the results of this analysis might dier from those in other reports.Additional InformationPublic health, regulatory, and food industry professionals can use this information to target prevention eorts aimed at pathogens and foods that cause the most outbreaks. Learn more about how outbreaks are reported and tracked at http://www.cdc.gov/foodsafety/fdoss/ ReferencesScallan E, Hoekstra RM, Angulo FJ, et al. Foodborne illness acquired in the United States—major pathogens. Emerging Infectious Diseases 2011; 17(1): 7–15.CDC. Guide to conrming a diagnosis in foodborne disease. Available at: http://www.cdc.gov/foodsafety/outbreaks/investigating-outbreaks/conrming_diagnosis.html. Accessed October 13, 2016.Interagency Food Safety Analytics Collaboration (IFSAC): Completed Projects. Available at: http://http://www.cdc.gov/foodsafety/ifsac/projects/completed.html. Accessed October 13, 2016.Figure: Rate of reported foodborne disease outbreaks per 1 million population* and number of outbreaks, by stateand conrmed and suspected etiology—Foodborne Disease Outbreak Surveillance System, United States, 2015. 3 for the most hospitalizations in outbreaks with a single conrmed etiologic agent were Salmonella in seeded vegetables (225 hospitalizations), Salmonellain pork (70), and Staphylococcus aureus enterotoxin in chicken (31). Deaths were reported for the following pathogen-food category pairs: Salmonella in seeded vegetables (6 deaths), Clostridium botulinum in root and underground vegetables (2); Clostridium perfringens in beef, Listeria monocytogenes in vegetable row crops, Salmonella in pork, Salmonellain sprouts, and Vibrio vulnicusLocation of Food PreparationAmong the 779 outbreaks and 12,054 illnesses with a reported single location where food was prepared, 469 outbreaks (60%) and 4,757 associated illnesses (39%) were attributed to foods prepared in a restaurant (Table 3a, Table 3b, and Table 3c). Among these outbreaks, sit-down dining-style was the type of restaurant most commonly reported as the location where food was prepared (373 outbreaks, 48%). RecallsTwenty outbreaks resulted in product recalls. The foods recalled in outbreaks in which exposure occurred in one state were apple cider, bread, chicken, drink mix, ground beef, muns, pork, raw tuna, roast beef, and unpasteurized milk (1 each). Alfalfa seeds and sprouts, celery, chicken, cucumber, our, lettuce, moringa leaf powder, pork, raw tuna, and sprouted nut butter (1 each) were recalled in multistate outbreaks.Multistate OutbreaksThirty multistate outbreaks (3% of all outbreaks) were reported (Table 4), resulting in 1,947 illnesses (12% of illnesses), 411 (42% of hospita

lizations), and 7 deaths (50% of deaths). Outbreaks involved a median of 7.5 states (range: 2–40). Seventeen outbreaks were caused by Salmonella; the serotypes were Newport (3 outbreaks); multiple serotypes (3); Enteritidis (2); Paratyphi B (2); Bareilly, Braenderup, Hartford, Java, Javiana, Poona, and Virchow (1 each). Ten multistate outbreaks were caused by STEC (serogroups O157 [4 outbreaks], O103 [2], O26 [2], O145 [1], and multiple serogroups [1]). One outbreak was caused by Cyclospora cayetanensis, one by Listeria, and one by Vibrio parahaemolyticus.The foods implicated or suspected as sources for multistate Salmonella outbreaks were tomatoes (2 outbreaks), tuna sushi (1 conrmed, 1 suspected), alfalfa seeds and sprouts, chicken, cucumber, Latin-style soft cheese (suspected), moringa leaf powder, pork, raw oysters (suspected), raw tuna, sprouted nut butter, sushi (suspected), true oil puree, and an unidentied food (1 each). For STEC, implicated foods were celery and onion (serogroup O157), our (O26 and O121), pizza dough mix (suspected) (O157), pre-packaged leafy greens (suspected) (O145), pre-packaged salad (suspected) (O157), romaine lettuce (suspected) (O157), and unidentied foods (serogroups O103 [2 outbreaks] and O26 [2 outbreaks]). The food implicated in the Cyclospora cayetanensis multistate outbreak was cilantro. Raw clams and raw oysters were implicated in the Vibrio parahaemolyticus outbreak, and contaminated lettuce was implicated in the Listeria outbreak.Multistate Outbreaks Spanning Multiple YearsFour multistate outbreaks investigated in 2015 are not included in the 2015 tally because the rst outbreak-associated illness occurred before 2015. Three were caused by Listeria; the implicated foods were ice cream (rst illness in 2010), caramel apples (rst illness in 2014), and cheese made with pasteurized milk (rst illness in 2014). One was caused by Salmonella; the implicated food was cashews (rst illness in 2014).LimitationsThe ndings in this report have at least three limitations. First, only a small proportion of foodborne illnesses that occur each year are identied as being associated with outbreaks. The extent to which the distribution of food vehicles and locations of preparation implicated in outbreaks reect the same vehicles and locations as sporadic foodborne illnesses is unknown. Similarly, not all outbreaks are identied, investigated, or reported. Second, many outbreaks had an unknown etiology, an unknown food vehicle, or both, and conclusions drawn from outbreaks with a conrmed etiology or food vehicle might not apply to other 2 in which exposure to the implicated food occurred in more than one state or territory. Population-based outbreak reporting rates were calculated for each state using U.S. Census estimates of the 2015 state populations (http://www.census.gov/popest). Multistate outbreaks were included in state population-based outbreak reporting rates by assigning one outbreak to each state that reported a case in the outbreak. Implicated foods were classied into 1 of 24 single-food categories if a single contaminated ingredient was identied or if all ingredients belonged to that category. Outbreaks attributed to foods that could not be assigned to one of these categories, or for which the report contained insucient information for category assignment, were not attributed to any category.FindingsStates and RatesDuring 2015, there were 902 foodborne disease outbreaks reported (Table 1), resulting in 15,202 illnesses, 950 hospitalizations, and 15 deaths. Outbreaks were reported by public health ocials from 50 states, Puerto Rico, and Washington D. C. (Figure). The median rate per million population was 3.5 outbreaks; rates ranged from 0.6 in Mississippi to 14.1 in Kansas.Etiologic AgentsA single etiologic agent was conrmed in 443 (49%) outbreaks (Table 1), which resulted in 10,008 (66%) illnesses. Bacteria caused the most outbreaks (238 outbreaks, 54%), followed by viruses (168, 38%), chemicals (33, 7%), and parasites (4, 1%). Norovirus was the most common cause of conrmed, single-etiology outbreaks, accounting for 164 (37%) outbreaks and 3,893 (39%) illnesses. Salmonella was the next most common cause, accounting for 149 (34%) outbreaks and 3,944 (39%) illnesses. Among the 146 conrmed Salmonella outbreaks with a serotype reported, Enteritidis was the most common (51 outbreaks, 35%), followed by I 4,[5],12:i:- (15, 10%), Newport (8, 6%), and Braenderup (7, 5%). Shiga toxin-producing Escherichia coli (STEC) caused 27 conrmed, single-etiology outbreaks, of which 17 (63%) were caused by serogroup O157, 3 (11%) by O26, 2 (7%) by O103, 1 (4%) by O45, 1 (4%) by O111, 1 (4%) by O121, 1 (4%) by O145, and 1 (4%) by multiple serogroups. Illnesses, Hospitalizations, and DeathsOf the 10,008 outbreak-associated illnesses caused by a single conrmed etiologic agent, 896 (9%) resulted in hospitalization (Table 1). Among conrmed, single-etiology outbreaks, Salmonella caused the most outbreak-associated hospitalizations (573 hospitalizations, 64%), followed by STEC (106, 12%) (53, 6%). Outbreaks caused by Clostridium botulinum resulted in the highest proportion of ill persons hospitalized (97%), followed by Listeria monocytogenes (90%) and Hepatitis A virus (38%). Among the 15 deaths reported, 14 (93%) were attributed to bacterial etiologies (Salmonella [9], Clostridium botulinumumClostridium perfringensfringensListeria monocytogenesogenesVibrio vulnicus[1]). One death was attributed to norovirus.Food Categories ImplicatedA food was reported for 360 (40%) outbreaks. In 194 (54%) of these outbreaks, the food could be classied into 1 of the 24 categories (Table 2a); the categories most commonly implicated were sh (34 outbreaks, 18%), chicken (22, 11%), pork (19, 10%), and dairy (18, 9%). Pasteurization information was reported for 14 of the dairy outbreaks and 13 (93%) of these involved unpasteurized products. The most outbreak-associated illnesses were from seeded vegetables (e.g., cucumbers or tomatoes, 1,121 illnesses), pork (924), vegetable row crops (e.g., leafy vegetables, 383), and chicken (333).Etiologic Agents and Food Category Pairs The pathogen-food category pairs responsible for most outbreaks with a single conrmed etiologic agent were ciguatoxin in sh (20 outbreaks), scombroid toxin Salmonella in chicken (9) (Table 2b). The pathogen-food category pairs responsible for the most illnesses in outbreaks with a single conrmed etiologic agent were Salmonellain seeded vegetables (1,048 illnesses), Salmonella in pork (615), and Salmonella in vegetable row crops (263). The pathogen-food category pairs responsible Surveillance for Foodborne Disease Outbreaks, United States2015 | Annual Report Surveillance for Foodborne Disease Outbreaks, United States2015 | Annual Report Surveillance for Foodborne Disease Outbreaks, United States2015 | Annual Report ContentsMain FindingsBackgroundFindingsLimitationsAdditional InformationReferences...........................................................................................................................................................................................Figure: Rate of reported foodborne disease outbreaks per 1 million population and number of outbreaks by state and etiology .................................................................................................................................................Table 1: Foodborne disease outbreaks, outbreak-asso

ciated illnesses, and hospitalizations, by etiologyTable 2a: Foodborne disease outbreaks and outbreak-associated illnesses, by food categoryTable 2b: Most common conrmed pathogen-food category pairs resulting in outbreaks and associated illnesses, hospitalizations, and deathsTable 3a: Foodborne disease outbreaks and associated illnesses, by location offood preparationTable 3b: Foodborne disease outbreaks and associated illnesses, by conrmed etiology and location of food preparationTable 3c: Foodborne disease outbreaks and associated illnesses, by suspected etiology and location of food preparationTable 4: Multistate foodborne disease outbreaksAppendix: Foodborne disease outbreaks by etiology and contributing factors 1 Main FindingsIn 2015, there were 902 foodborne disease outbreaks reported, resulting in 15,202 illnesses, 950 hospitalizations, 15 deaths, and 20 food product recalls.Norovirus was the most common cause of conrmed, single-etiology outbreaks, accounting for 164 (37%) outbreaks and 3,893 (39%) illnesses. Salmonella was the next most common cause, accounting for 149 (34%) outbreaks and 3,944 (39%) illnesses, followed by Shiga toxin-producing Escherichia coli, which caused 27 (6%) conrmed single-etiology outbreaks and 302 (3%) illnesses.Fish (34 outbreaks), chicken (22), and pork (19) were the most common single food categories implicated. The most outbreak-associated illnesses were from seeded vegetables (e.g., cucumbers or tomatoes, 1,121 illnesses), pork (924), and vegetable row crops (e.g., leafy vegetables, 383).As reported in previous years, restaurants (469 outbreaks, 60% of outbreaks reporting a single location of preparation), specically restaurants with sit-down dining (373, 48%), were the most commonly reported locations of food preparation associated with outbreaks. BackgroundFoodborne diseases due to known pathogens are estimated to cause 9.4 million illnesses each year in the United States. Although relatively few of these illnesses occur in the setting of a recognized outbreak, data collected during outbreak investigations provide insight into the pathogens and foods that cause illness. Public health ocials, regulatory agencies, and the food industry can use these data to create control strategies along the farm-to-table continuum that target specic pathogens and foods. An outbreak of foodborne disease is dened as the occurrence of two or more cases of a similar illness resulting from ingestion of a common food.Foodborne disease outbreaks are a nationally notiable condition (http://c.ymcdn.com/sites/www.cste.org/resource/resmgr/CSTENotiableConditionListA.pdf). CDC conducts surveillance of foodborne disease outbreaks in the United States through the Foodborne Disease Outbreak Surveillance System. Public health agencies in all 50 states, the District of Columbia, and U.S. territories voluntarily submit reports of outbreaks investigated by their agencies using a Web-based reporting platform, the National Outbreak Reporting System (NORS) (http://www.cdc.gov/). NORS also collects reports of enteric disease outbreaks with other transmission modes, including water, animal contact, person-to-person contact, environmental contamination, and unidentied modes. Agencies use a standard form (https://www.cdc.gov/nors/downloads/form-52-13.pdf) to report foodborne disease outbreaks. Data requested for each outbreak include: the reporting state; date of rst illness onset; number of illnesses, hospitalizations, and deaths; etiology; implicated food(s) and ingredient(s); locations of food preparation; and factors contributing to food contamination (see appendix). The reporting form also allows for reporting the reason(s) a particular food is suspected as the source; ve choices are provided http://www.cdc.gov/nors/downloads/guidance.). All foods implicated are included in analyses, regardless of the reasons suspected. Implicated foods in multistate outbreaks are further classied as conrmed or suspected based on epidemiologic, traceback, and laboratory evidence. A food is considered the conrmed source if two types of evidence are obtained, while a food is considered suspected if only one type of evidence is available. Reports of outbreaks on cruise ships that dock in both U.S. and international ports and those in which the food was eaten outside the United States, even if the illness occurred in the United States, are excluded from the Foodborne Disease Outbreak Surveillance System.This report includes foodborne disease outbreaks reported by October 20, 2016, in which the rst illness onset occurred in 2015. Etiologic agents were reported as conrmed if predened criteria were met; otherwise, they were reported as suspected. In some outbreaks the etiologic agent is unknown. For outbreaks caused by a single conrmed or suspected etiology, etiologies were grouped as bacterial, chemical and toxin, parasitic, or viral. Multistate outbreaks were dened as outbreaks Surveillance for Foodborne Disease Outbreaks United States 2015 Annual Report AcknowledgementsThe ndings in this study are based, in part, on contributions by state, local, and territorial health departments. Suggested CitationCenters for Disease Control and Prevention (CDC). Surveillance for Foodborne Disease Outbreaks, United States, 2015, Annual Report. Atlanta, Georgia: US Department of Health and Human Services, CDC, 2017.Report compiled byDaniel Dewey-Mattia, Karunya Manikonda, Julia Chen, Hannah Kisselburgh, Caroline Pilewski, Preethi Sundararaman, and Samuel Crowe Centers for Disease Control and PreventionDivision of Foodborne, Waterborne, and Environmental Diseases1600 Clifton Road, Mail Stop C-09, Atlanta, GA 30329-4027Telephone: 404.639.2206NORS-Foodborne@cdc.govWeb: http://www.cdc.gov/foodsafety/fdoss/ Surveillance for Foodborne Disease Outbreaks United States, 2015: Annual Report 13 Appendix Table 1: Foodborne disease outbreaks by conrmed etiology* and contributing factors—Foodborne Disease Outbreak Surveillance System, United States, 2015. Contamination FactorsNo. outbreaks with reported contributing factorsTotal No. outbreaksEtiology1 factor reportedBacterialSalmonella149Clostridium perfringensEscherichia coli, Shiga toxin-producingCampylobacterStaphylococcus aureus enterotoxinBacillus cereus Vibrio parahaemolyticusStaphylococcus Clostridium botulinumListeria monocytogenesVibrio vulnicusStreptococcus, Group A Escherichia coli, EnteropathogenicYersinia enterocoliticaOtherSubtotal124238Chemical and toxinCiguatoxinScombroid toxinHistaminePuer sh tetrodotoxin OtherSubtotal29ParasiticCryptosporidiumTrichinellaCyclosporaSubtotalViralNorovirus 164Hepatitis A virusSapovirusSubtotal1682929214243443Total2929219248451Appendices’ footnotes are on page 19. For more information, please contact:Centers for Disease Control and Prevention1600 Clifton Road NE, Atlanta, GA 30333Telephone: 1-800-CDC-INFO (232-4636)TTY: 1-888-232-6348cdcinfo@cdc.govWeb: http://www.cdc.gov CS275193-A 19 Appendix: Reported foodborne disease outbreaks, by conrmed and suspected etiology* and contributing factors—Foodborne Disease Outbreak Surveillance System, United States, 2015* If at least one etiology was laboratory-conrmed, the outbreak was considered to have a conrmed etiology. If no etiology was laboratory-conrmed but an etiology was reported based on clinical or epidemiologic features, the outbreak was considered to have a suspected etiology.. Contributing factors are dened as risk fa

ctors that either enable an outbreak to occur or amplify an outbreak caused by other means. Contributing factors are classied into three categories: contamination factors (factors that introduce or otherwise permit contamination), proliferation/amplication factors (factors that allow proliferation or growth of the etiologic agent), and survival factors (factors that allow survival or fail to inactivate a contaminant). More than one contributing factor might be reported per outbreak.Contributing factors:C1: toxic substance part of the tissueC2: poisonous substance intentionally/deliberately addedC3: poisonous substance accidentally/inadvertently addedC4: addition of excessive quantities of ingredients that are toxic in large amountsC5: toxic containerC6: contaminated raw product—food that was intended to be consumed after a kill stepC7: contaminated raw product—food was intended to be consumed raw or undercooked/underprocessedC8: foods originating from sources shown to be contaminated or polluted (such as a growing eld or harvest area)C9: cross-contamination of ingredients (cross-contamination does not include ill food workers)C10: bare-handed contact by a food handler/worker/preparer who is suspected to be infectiousC11: glove-handed contact by a food handler/worker/preparer who is suspected to be infectiousC12: other mode of contamination (excluding cross-contamination) by a food handler/worker/preparer who is suspected to be infectiousC13: foods contaminated by non-food handler/worker/preparer who is suspected to be infectiousC14: storage in a contaminated environmentC15: other source of contaminationP1: food preparation practices that support proliferation of pathogens (during food preparation)P2: no attempt was made to control the temperature of implicated food or the length of time food was out of temperature control (during food service or display of food)P3: improper adherence of approved plan to use Time as a Public Health ControlP4: improper cold holding due to malfunctioning refrigeration equipmentP5: improper cold holding due to an improper procedure or protocolP6: improper hot holding due to malfunctioning equipmentP7: improper hot holding due to improper procedure or protocolP8: improper/slow coolingP9: prolonged cold storageP10: inadequate modied atmospheric packagingP11: inadequate processing (acidication, water activity, fermentation)P12: other situations that promoted or allowed microbial growth or toxin productionS1: insucient time and/or temperature control during initial cooking/heat processingS2: insucient time and/or temperature during reheatingS3: insucient time and/or temperature control during freezingS4: insucient or improper use of chemical processes designed for pathogen destructionS5: other process failures that permit pathogen survivalNo outbreaks in the data reported fall in this category.An etiologic agent was not conrmed or suspected based on clinical, laboratory, or epidemiologic information. 18 Appendix Table 6: Foodborne disease outbreaks by suspected etiology* and contributing factors—Foodborne Disease Outbreak Surveillance System, United States, 2015. Survival FactorsNo. outbreaks with reported contributing factorsTotal No. outbreaksEtiology1 factor reportedBacterialSalmonellaClostridium perfringensEscherichia coli, Shiga toxin-producingCampylobacterStaphylococcus aureus enterotoxinBacillus cereusVibrio parahaemolyticusStaphylococcus sppClostridium botulinumListeria monocytogenesVibrio vulnicusStreptococcus, Group A Escherichia coli, EnteropathogenicYersinia enterocoliticaOtherSubtotalChemical and toxinCiguatoxinScombroid toxinHistaminePuer sh tetrodotoxinOtherSubtotalParasiticCryptosporidiumTrichinellaCyclosporaSubtotalViralNorovirus147Hepatitis A virus SapovirusSubtotal14892232Unknown etiology209Total149451Appendices’ footnotes are on page 19. 17 Appendix Table 5: Foodborne disease outbreaks by suspected etiology* and contributing factors—Foodborne Disease Outbreak Surveillance System, United States, 2015. ProliferationAmplication FactorsNo. outbreaks with reported contributing factorsTotal No. outbreaksEtiology1 factor reportedBacterialSalmonellaClostridium perfringensEscherichia coli, Shiga toxin-producingCampylobacterStaphylococcus aureus enterotoxinBacillus cereusVibrio parahaemolyticus Staphylococcus sppClostridium botulinumListeria monocytogenesVibrio vulnicusStreptococcus, Group AEscherichia coli, EnteropathogenicYersinia enterocoliticaOther SubtotalChemical and toxinCiguatoxinScombroid toxinHistaminePuer sh tetrodotoxinOtherSubtotalParasiticCryptosporidiumTrichinella CyclosporaSubtotalViral147NorovirusHepatitis A virusSapovirus148Subtotal92232 209Unknown etiology149451Total156398Appendices’ footnotes are on page 19. 16 Appendix Table 4: Foodborne disease outbreaks by suspected etiology* and contributing factors—Foodborne Disease Outbreak Surveillance System, United States, 2015. Contamination FactorsNo. outbreaks with reported contributing factorsTotal No. outbreaksEtiology1 factor reportedBacterialSalmonellaClostridium perfringensEscherichia coli, Shiga toxin-producingCampylobacterStaphylococcus aureus enterotoxinBacillus cereus Vibrio parahaemolyticusStaphylococcus Clostridium botulinumListeria monocytogenesVibrio vulnicusStreptococcus, Group A Escherichia coli, EnteropathogenicYersinia enterocoliticaOtherSubtotalChemical and toxinCiguatoxinScombroid toxinHistaminePuer sh tetrodotoxin OtherSubtotalParasiticCryptosporidiumTrichinellaCyclosporaSubtotalViralNorovirus 147Hepatitis A virusSapovirusSubtotal14892232Unknown etiology209Total115149451 Appendices’ footnotes are on page 19. 15 Appendix Table 3: Foodborne disease outbreaks by conrmed etiology* and contributing factors—Foodborne Disease Outbreak Surveillance System, United States, 2015. Survival FactorsNo. outbreaks with reported contributing factorsTotal No. outbreaksEtiology1 factor reportedBacterialSalmonella149Clostridium perfringensEscherichia coli, Shiga toxin-producingCampylobacterStaphylococcus aureus enterotoxinBacillus cereusVibrio parahaemolyticusStaphylococcus Clostridium botulinumListeria monocytogenesVibrio vulnicusStreptococcus, Group A Escherichia coli, EnteropathogenicYersinia enterocoliticaOtherSubtotal124238Chemical and toxinCiguatoxinScombroid toxinHistaminePuer sh tetrodotoxinOtherSubtotalParasiticCryptosporidiumTrichinellaCyclosporaSubtotalViralNorovirus164Hepatitis A virus SapovirusSubtotal168243443Total248451Appendices’ footnotes are on page 19. 14 Appendix Table 2: Foodborne disease outbreaks by conrmed etiology* and contributing factors—Foodborne Disease Outbreak Surveillance System, United States, 2015. ProliferationAmplication FactorsNo. outbreaks with reported contributing factorsTotal No. outbreaksEtiology1 factor reportedBacterialSalmonella149Clostridium perfringensEscherichia coli, Shiga toxin-producingCampylobacterStaphylococcus aureus enterotoxinBacillus cereusVibrio parahaemolyticus Staphylococcus Clostridium botulinumListeria monocytogenesVibrio vulnicusStreptococcus, Group AEscherichia coli, EnteropathogenicYersinia enterocoliticaOther Subtotal124238Chemical and toxinCiguatoxinScombroid toxinHistaminePuer sh tetrodotoxinOtherSubtotalParasiticCryptosporidiumTrichinella CyclosporaSubtotalViralNorovirus164Hepatitis A virusSapovirusSubtotal168243443Total 248451Appendices’ footnotes are on page 19. 12 Table 4: Multistate foodborne

disease outbreaks, United States, 2015. Implicated food*Month of rst Etiology No. No. hospitalizationsNo. deathsNo. states involvedConrmedRecallMarchSalmonella serotypeParatyphi BLettuceYesMarchSalmonella serotypes Weltevreden and Paratyphi BRaw tunaYesYesMarchShiga toxin-producing E. coli O103No food reportedMarchSalmonella serotype NewportLatin-style soft cheeseMarchShiga toxin-producing E. coli O157:H7Romaine lettuceAprilSalmonella serotype EnteritidisChickenYesYesAprilShiga toxin-producing E. coli O145Prepackaged leafy greensAprilSalmonella serotypes Infantis and I 4,[5],12:i:-192PorkYesYesMaySalmonella serotype HartfordTomatoesMayCyclospora cayetanensisCilantroMaySalmonella serotype Paratyphi BTuna sushiVibrio parahaemolyticusRaw oysters; raw clamsYesListeria monocytogenesLettuceYesYesSalmonella serotype Newport Raw oystersSalmonella serotype Poona907204CucumberYesYesSalmonella serotype JavaSprouted nut butterYesYesSalmonella serotype JavianaNo food reportedAugustSalmonella serotype EnteritidisTruffle oil pureeYesAugustSalmonella serotype BareillyTuna sushiYesAugustSalmonella serotype Newport119TomatoYesSeptemberSalmonella serotype BraenderupSushiOctoberhiga toxin-producing E. coli O26No food reportedOctoberShiga toxin-producing E. coli O157:H7Pre-packaged saladOctoberShiga toxin-producing E. coli O103No food reportedOctoberShiga toxin-producing E. coli O157:H7Celery; onionYesYesNovemberShiga toxin-producing E. coli O26No food reportedDecemberSalmonella serotypes Kentucky, Cubana, and MuenchenAlfalfa sprouts; alfalfa sprout seedsYesYesDecemberShiga toxin-producing E. coli O26:NM and O121FlourYesYesDecemberSalmonella serotype Virchow Moringa leaf powderYesYesDecemberShiga toxin-producing E. coli O157:H7Pizza dough mix* Implicated foods in multistate outbreaks are further classied as conrmed or suspected based on epidemiologic, traceback, and laboratory evidence. A food is considered the conrmed source if two types of evidence are obtained, while a food is considered suspected if only one type of evidence is available. 11 Table 3c: Foodborne disease outbreaks and outbreak-associated illnesses, by suspected* etiology and location of food preparation—Foodborne Disease Outbreak Surveillance System, United State, 2015. Catering or facilityRestaurantOther commercial locationInstitutional locationPrivate Other private locationOther locationEtiologyBacterialSalmonellaClostridium perfringens150Escherichia coli, Shiga toxin-producingCampylobacterStaphylococcus aureus enterotoxinBacillus cereus Vibrio parahaemolyticusStaphylococcus sppClostridium botulinumListeria monocytogenesVibrio vulnicusStreptococcus, Group AEscherichia coli, Enteropathogenic Yersinia enterocoliticaOtherSubtotal239209107Chemical and toxinCiguatoxinScombroid toxinHistaminePuer sh tetrodotoxinOtherSubtotal ParasiticCryptosporidiumTrichinellaCyclosporaSubtotalViralNorovirus471106648229Hepatitis A virusSapovirusSubtotal 471107651229710144863342130Unknown etiology825118570144192Total15802671469229534207Abbreviations: NO = number of outbreaks; NI = number of illnesses.* If at least one etiology was conrmed based on dened criteria (http://www.cdc.gov/foodsafety/outbreaks/investigating-outbreaks/conrming_diagnosis.html), the outbreak was considered to have a conrmed etiology. If an etiology was reported but not conrmed, the outbreak was considered to have a suspected etiology. Reported locations were grouped as follows: catering or banquet facility, restaurant, other commorcial location, hospital or nursing home, other institutional location, private home, other private location, and other location (includes Hotal or motel and Ship or boat) (see Table 3a). No outbreaks in the data reported fall into this category. An etiologic agent was not conrmed or suspected based on clinical, laboratory, or epidemiologic information. 10 Table 3b: Foodborne disease outbreaks and outbreak-associated illnesses, by conrmed* etiology and location of food preparation—Foodborne Disease Outbreak Surveillance System, United State, 2015. Catering or facilityRestaurantOther commercial locationInstitutional locationPrivate Other private locationOther locationEtiologyBacterialSalmonella1911102402282259Clostridium perfringens92221120Escherichia coli, Shiga toxin-producing120Campylobacter29Staphylococcus aureus enterotoxin144Bacillus cereus Vibrio parahaemolyticus226Staphylococcus sppClostridium botulinumListeria monocytogenesVibrio vulnicusStreptococcus, Group AEscherichia coli, Enteropathogenic Yersinia enterocoliticaOtherSubtotal3261607493721500Chemical and toxinCiguatoxinScombroid toxinHistaminePuer sh tetrodotoxinOtherSubtotal43 ParasiticCryptosporidium103TrichinellaCyclosporaSubtotal103ViralNorovirus964148913749911029143Hepatitis A virusSapovirusSubtotal 96414981374991102914312901993238744122023150178Total130020232887891398231Abbreviations: NO = number of outbreaks; NI = number of illnesses.* If at least one etiology was conrmed based on dened criteria (http://www.cdc.gov/foodsafety/outbreaks/investigating-outbreaks/conrming_diagnosis.html), the outbreak was considered to have a conrmed etiology. If an etiology was reported but not conrmed, the outbreak was considered to have a suspected etiology. Reported locations were grouped as follows: catering or banquet facility, restaurant, other commorcial location, hospital or nursing home, other institutional location, private home, other private location, and other location (includes Hotel or motel and Ship or boat) (see Table 3a). No outbreaks in the data reported fall into this category. 9 Table 3a: Foodborne disease outbreaks and outbreak-associated illnesses, by location of food preparation—Foodborne Disease Outbreak Surveillance System, United States, 2015. No. OutbreaksNo. IllnessesLocationTotalTotalRestaurant4694757Sit-down dining3733632Fast-food651BuetOther or unknown type303Multiple types171Catering or banquet facility1122880Private home873Institutional location1932School622Prison or jail988Camp104Day CareOce or indoor workplaceOtherOther location239Other commercial location855Grocery store572Fair, festival, or temporary mobile service104Farm or dairy140Other328313Other private locationPlace of worship Other50Hotel or motelShip or boatSingle location*77912054Multiple locations1552Unknown location1596Total90210015202100* The denominator for the location percentages is the single location total. The denominator for the single location, multiple locations, and unknown location is the total. Because of rounding, numbers might not add up to the single location total or the total. 8 Table 2b: Most common conrmed pathogen-food category pairs resulting in outbreaks, outbreak-associated illnesses, hospitalizations, and deaths—Foodborne Disease Outbreak Surveillance System, United States, 2015. Top 5 pathogen-food category pairs resulting in outbreaksEtiologyFood Category*No. OutbreaksNo. IllnessesNo. HospitalizationsNo. DeathsCiguatoxinFishScombroid toxinHistamineFishSalmonellaChickenSalmonellaPork615CampylobacterDairy Top 5 pathogen-food category pairs resulting in outbreak-associated illnessesEtiologyFood Category*No. OutbreaksNo. IllnessesNo. HospitalizationsNo. DeathsSalmonellaSeeded vegetables1048225SalmonellaPork615SalmonellaVegetable row crops263NorovirusOther225Clostridium perfringensPork217 Top 5 pathogen-food category pairs resulting in outbreak-associated hospitalizationsEtiologyFood Category*No. OutbreaksNo. IllnessesNo. HospitalizationsNo. De

athsSalmonellaSeeded vegetables1048225SalmonellaPork615Staphylococcus aureus enterotoxinChicken102Clostridium botulinumRoot and other underground vegetablesEscherichia coli, Shiga toxin-producingGrains and beans Pathogen-food category pairs resulting in outbreak-associated deathsEtiologyFood Category*No. OutbreaksNo. IllnessesNo. HospitalizationsNo. DeathsSalmonellaSeeded Vegetables1048225Clostridium botulinumRoot and other underground vegetablesSalmonellaPork615Clostridium perfringensBeef134SalmonellaSproutsListeria monocytogenesVegetable row cropsVibrio vulnicusMollusks* Interagency Food Safety Analytics Collaboration (IFSAC) food categorization scheme: http://www.cdc.gov/foodsafety/ifsac/projects/completed.html 7 Table 2a: Foodborne disease outbreaks and outbreak-associated illnesses, by food category*—Foodborne Disease Outbreak Surveillance System, United States, 2015. No. OutbreaksNo. IllnessesFood Category*TotalTotalAquatic animalsCrustaceans164Fish176Other aquatic animalsSubtotal359Dairy116EggsBeef225Pork924ChickenTurkey137Other poultryGameSubtotal1819PlantsSproutsRoot and other underground vegetablesSeeded vegetables¶1121132Vegetable row crops**383FruitsGrains and beansSubtotal1939Other 247Food reported, attributed to a single food category194436429Food reported with ingredients that belong t�o 1 food category1662889No food reported542794952Total90210015202100* Interagency Food Safety Analytics Collaboration (IFSAC) food categorization scheme: http://www.cdc.gov/foodsafety/ifsac/projects/completed.html Bivalve mollusks (16 outbreaks). Unpasteurized dairy products (13 outbreaks), pasteurization unknown (4), and pasteurized dairy products (1). Roots (2 outbreaks) and tubers (2). Solanaceous seeded vegetables (3 outbreaks), vine-grown seeded vegetables (3), legumes (1), and other seeded vegetables (1).** Leafy vegetables (10 outbreaks). Pome fruits (4 outbreaks) and fruits not further classied (2). Grains (6 outbreaks) and beans (1). Nuts (1 outbreak). The denominator for the food category percentages is the "food reported, attributed to a single food category" total. The denominator for the "food reported attributed to a single food category", "food reported, not attributed to a single food category", and "No food reported" is the total. Because of rounding, numbers might not add up to the ”food reported, attributed to a single food category“ total or the total. 6 Table 1: Foodborne disease outbreaks, outbreak-associated illnesses, and hospitalizations, by etiology (conrmed or suspected)* — Foodborne Disease Outbreak Surveillance System, United States, 2015. No. OutbreaksNo. IllnessesNo. HospitalizationsEtiologyTotalTotalTotalBacterialSalmonella14915839444035573574Clostridium perfringens6863421028Escherichia coli, Shiga toxin-producing (STEC)302350106115Campylobacter212258Staphylococcus aureus enterotoxin236291Bacillus cereusVibrio parahaemolyticus234242Staphylococcus spp Clostridium botulinumListeria monocytogenesVibrio vulnicusStreptococcus, Group AEscherichia coli, EnteropathogenicYersinia enterocoliticaOtherSubtotal2383165782715649752834849Chemical and toxinCiguatoxinScombroid toxinHistamine Puer sh tetrodotoxinOtherSubtotal115139ParasiticCryptosporidium105105TrichinellaCyclosporaSubtotal201201ViralNorovirus164147311389316525545Hepatitis A virusSapovirusSubtotal168 148316391016555565684432326751000823941240289692898283184467Unknown etiology209209233323332333Total4514519021001033548671520210090743950100Abbreviations: CE = conrmed etiology; SE = suspected etiology.* If at least one etiology was conrmed based on dened criteria (http://www.cdc.gov/foodsafety/outbreaks/investigating-outbreaks/conrming_diagnosis.html), the outbreak was considered to have a conrmed etiology. If an etiology was reported but not conrmed, the outbreak was considered to have a suspected etiology.Salmonella serotypes causing more than ve outbreaks were Enteritidis (53 outbreaks), I 4,[5],12:i:- (17), Newport (8), Braenderup (7), and Typhimurium (6).Campylobacter jejuni (20 outbreaks), Campylobacter unknown species (12), and Campylobacter § STEC serogroups O157 (21 outbreaks), O26 (4), O103 (2), O111 (1), O145 (1), O121 (1), O45 (1), multiple serogroups (1), and unknown serogroup (2).(6 outbreaks).** The denominator for the individual etiology percentages is the single etiology total. The denominator for the single etiology, multiple etiologies, and unknown etiology is the total of all outbreaks. Because of rounding, numbers might not add up to the single etiology total or the total of all outbreaks.††An etiologic agent was not conrmed or suspected based on clinical, laboratory, or epidemiologic information. 5 1 * Cut points for outbreak rate categories determined using quartiles. Legend diers for each map. Reported outbreaks in each state. Puerto Rico reported 2 outbreaks and Washington D. C. reported 3 outbreaks (not shown). Includes 30 multistate outbreaks (i.e., outbreaks in which exposure occurred in more than one state) assigned as an outbreak to each state involved. Multistate outbreaks involved a median of 7.5 states (range: 2–40). If at least one etiology was conrmed based on dened criteria (http://www.cdc.gov/foodsafety/outbreaks/investigating-outbreaks/conrming_diagnosis.html), the outbreak was considered to have a conrmed etiology. If an etiology was reported but not conrmed, the outbreak was considered to have a suspected etiology. 4 outbreaks. Finally, CDC’s outbreak surveillance system is dynamic. Agencies can submit new reports and change or delete reports as information becomes available. Therefore, the results of this analysis might dier from those in other reports.Additional InformationPublic health, regulatory, and food industry professionals can use this information to target prevention eorts aimed at pathogens and foods that cause the most outbreaks. Learn more about how outbreaks are reported and tracked at http://www.cdc.gov/foodsafety/fdoss/ ReferencesScallan E, Hoekstra RM, Angulo FJ, et al. Foodborne illness acquired in the United States—major pathogens. Emerging Infectious Diseases 2011; 17(1): 7–15.CDC. Guide to conrming a diagnosis in foodborne disease. Available at: http://www.cdc.gov/foodsafety/outbreaks/investigating-outbreaks/conrming_diagnosis.html. Accessed October 13, 2016.Interagency Food Safety Analytics Collaboration (IFSAC): Completed Projects. Available at: http://http://www.cdc.gov/foodsafety/ifsac/projects/completed.html. Accessed October 13, 2016.Figure: Rate of reported foodborne disease outbreaks per 1 million population* and number of outbreaks, by stateand conrmed and suspected etiology—Foodborne Disease Outbreak Surveillance System, United States, 2015. 3 for the most hospitalizations in outbreaks with a single conrmed etiologic agent were Salmonella in seeded vegetables (225 hospitalizations), Salmonellain pork (70), and Staphylococcus aureus enterotoxin in chicken (31). Deaths were reported for the following pathogen-food category pairs: Salmonella in seeded vegetables (6 deaths), Clostridium botulinum in root and underground vegetables (2); Clostridium perfringens in beef, Listeria monocytogenes in vegetable row crops, Salmonella in pork, Salmonellain sprouts, and Vibrio vulnicusLocation of Food PreparationAmong the 779 outbreaks and 12,054 illnesses with a reported single location where food was prepared, 469 outbreaks (60%) and 4,757 associated illn

esses (39%) were attributed to foods prepared in a restaurant (Table 3a, Table 3b, and Table 3c). Among these outbreaks, sit-down dining-style was the type of restaurant most commonly reported as the location where food was prepared (373 outbreaks, 48%). RecallsTwenty outbreaks resulted in product recalls. The foods recalled in outbreaks in which exposure occurred in one state were apple cider, bread, chicken, drink mix, ground beef, muns, pork, raw tuna, roast beef, and unpasteurized milk (1 each). Alfalfa seeds and sprouts, celery, chicken, cucumber, our, lettuce, moringa leaf powder, pork, raw tuna, and sprouted nut butter (1 each) were recalled in multistate outbreaks.Multistate OutbreaksThirty multistate outbreaks (3% of all outbreaks) were reported (Table 4), resulting in 1,947 illnesses (12% of illnesses), 411 (42% of hospitalizations), and 7 deaths (50% of deaths). Outbreaks involved a median of 7.5 states (range: 2–40). Seventeen outbreaks were caused by Salmonella; the serotypes were Newport (3 outbreaks); multiple serotypes (3); Enteritidis (2); Paratyphi B (2); Bareilly, Braenderup, Hartford, Java, Javiana, Poona, and Virchow (1 each). Ten multistate outbreaks were caused by STEC (serogroups O157 [4 outbreaks], O103 [2], O26 [2], O145 [1], and multiple serogroups [1]). One outbreak was caused by Cyclospora cayetanensis, one by Listeria, and one by Vibrio parahaemolyticus.The foods implicated or suspected as sources for multistate Salmonella outbreaks were tomatoes (2 outbreaks), tuna sushi (1 conrmed, 1 suspected), alfalfa seeds and sprouts, chicken, cucumber, Latin-style soft cheese (suspected), moringa leaf powder, pork, raw oysters (suspected), raw tuna, sprouted nut butter, sushi (suspected), true oil puree, and an unidentied food (1 each). For STEC, implicated foods were celery and onion (serogroup O157), our (O26 and O121), pizza dough mix (suspected) (O157), pre-packaged leafy greens (suspected) (O145), pre-packaged salad (suspected) (O157), romaine lettuce (suspected) (O157), and unidentied foods (serogroups O103 [2 outbreaks] and O26 [2 outbreaks]). The food implicated in the Cyclospora cayetanensis multistate outbreak was cilantro. Raw clams and raw oysters were implicated in the Vibrio parahaemolyticus outbreak, and contaminated lettuce was implicated in the Listeria outbreak.Multistate Outbreaks Spanning Multiple YearsFour multistate outbreaks investigated in 2015 are not included in the 2015 tally because the rst outbreak-associated illness occurred before 2015. Three were caused by Listeria; the implicated foods were ice cream (rst illness in 2010), caramel apples (rst illness in 2014), and cheese made with pasteurized milk (rst illness in 2014). One was caused by Salmonella; the implicated food was cashews (rst illness in 2014).LimitationsThe ndings in this report have at least three limitations. First, only a small proportion of foodborne illnesses that occur each year are identied as being associated with outbreaks. The extent to which the distribution of food vehicles and locations of preparation implicated in outbreaks reect the same vehicles and locations as sporadic foodborne illnesses is unknown. Similarly, not all outbreaks are identied, investigated, or reported. Second, many outbreaks had an unknown etiology, an unknown food vehicle, or both, and conclusions drawn from outbreaks with a conrmed etiology or food vehicle might not apply to other 2 in which exposure to the implicated food occurred in more than one state or territory. Population-based outbreak reporting rates were calculated for each state using U.S. Census estimates of the 2015 state populations (http://www.census.gov/popest). Multistate outbreaks were included in state population-based outbreak reporting rates by assigning one outbreak to each state that reported a case in the outbreak. Implicated foods were classied into 1 of 24 single-food categories if a single contaminated ingredient was identied or if all ingredients belonged to that category. Outbreaks attributed to foods that could not be assigned to one of these categories, or for which the report contained insucient information for category assignment, were not attributed to any category.FindingsStates and RatesDuring 2015, there were 902 foodborne disease outbreaks reported (Table 1), resulting in 15,202 illnesses, 950 hospitalizations, and 15 deaths. Outbreaks were reported by public health ocials from 50 states, Puerto Rico, and Washington D. C. (Figure). The median rate per million population was 3.5 outbreaks; rates ranged from 0.6 in Mississippi to 14.1 in Kansas.Etiologic AgentsA single etiologic agent was conrmed in 443 (49%) outbreaks (Table 1), which resulted in 10,008 (66%) illnesses. Bacteria caused the most outbreaks (238 outbreaks, 54%), followed by viruses (168, 38%), chemicals (33, 7%), and parasites (4, 1%). Norovirus was the most common cause of conrmed, single-etiology outbreaks, accounting for 164 (37%) outbreaks and 3,893 (39%) illnesses. Salmonella was the next most common cause, accounting for 149 (34%) outbreaks and 3,944 (39%) illnesses. Among the 146 conrmed Salmonella outbreaks with a serotype reported, Enteritidis was the most common (51 outbreaks, 35%), followed by I 4,[5],12:i:- (15, 10%), Newport (8, 6%), and Braenderup (7, 5%). Shiga toxin-producing Escherichia coli (STEC) caused 27 conrmed, single-etiology outbreaks, of which 17 (63%) were caused by serogroup O157, 3 (11%) by O26, 2 (7%) by O103, 1 (4%) by O45, 1 (4%) by O111, 1 (4%) by O121, 1 (4%) by O145, and 1 (4%) by multiple serogroups. Illnesses, Hospitalizations, and DeathsOf the 10,008 outbreak-associated illnesses caused by a single conrmed etiologic agent, 896 (9%) resulted in hospitalization (Table 1). Among conrmed, single-etiology outbreaks, Salmonella caused the most outbreak-associated hospitalizations (573 hospitalizations, 64%), followed by STEC (106, 12%) (53, 6%). Outbreaks caused by Clostridium botulinum resulted in the highest proportion of ill persons hospitalized (97%), followed by Listeria monocytogenes (90%) and Hepatitis A virus (38%). Among the 15 deaths reported, 14 (93%) were attributed to bacterial etiologies (Salmonella [9], Clostridium botulinumumClostridium perfringensfringensListeria monocytogenesogenesVibrio vulnicus[1]). One death was attributed to norovirus.Food Categories ImplicatedA food was reported for 360 (40%) outbreaks. In 194 (54%) of these outbreaks, the food could be classied into 1 of the 24 categories (Table 2a); the categories most commonly implicated were sh (34 outbreaks, 18%), chicken (22, 11%), pork (19, 10%), and dairy (18, 9%). Pasteurization information was reported for 14 of the dairy outbreaks and 13 (93%) of these involved unpasteurized products. The most outbreak-associated illnesses were from seeded vegetables (e.g., cucumbers or tomatoes, 1,121 illnesses), pork (924), vegetable row crops (e.g., leafy vegetables, 383), and chicken (333).Etiologic Agents and Food Category Pairs The pathogen-food category pairs responsible for most outbreaks with a single conrmed etiologic agent were ciguatoxin in sh (20 outbreaks), scombroid toxin Salmonella in chicken (9) (Table 2b). The pathogen-food category pairs responsible for the most illnesses in outbreaks with a single conrmed etiologic agent were Salmonellain seeded vegetables (1,048 illnesses), Salmonella in pork (615), and Salmonella in vegetable row crops (263). The pathogen-food cat