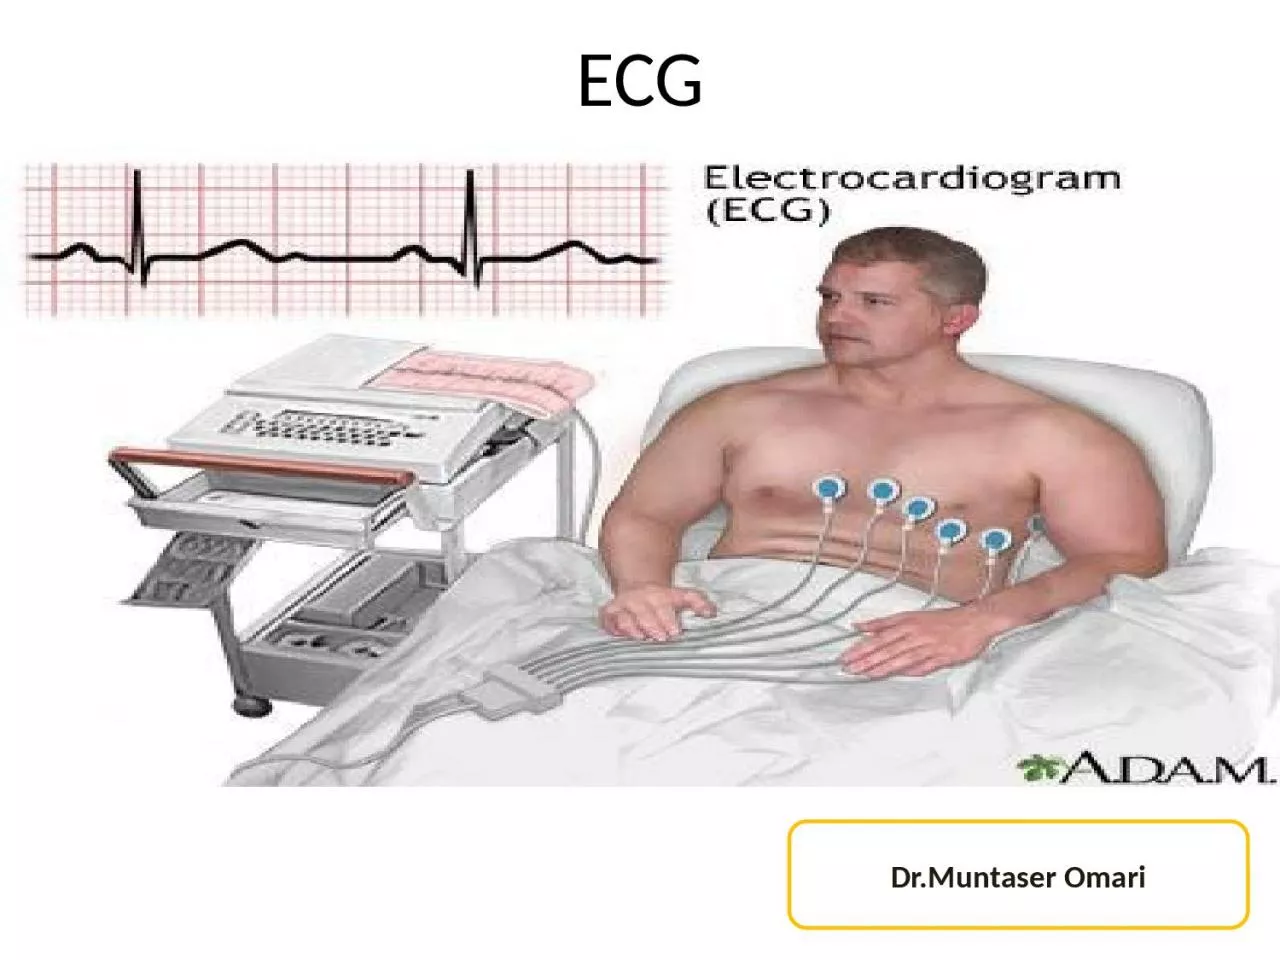
Stands for electrocardiogram EKG its a record of the hearts electrical activity This activity recorded in a form of waves each wave has its own characteristic Electrical activity means the depolarization and repolarization of the myocardium ID: 920612
Download Presentation The PPT/PDF document "ECG Dr.Muntaser Omari ECG" is the property of its rightful owner. Permission is granted to download and print the materials on this web site for personal, non-commercial use only, and to display it on your personal computer provided you do not modify the materials and that you retain all copyright notices contained in the materials. By downloading content from our website, you accept the terms of this agreement.
Slide1
ECG
Dr.Muntaser Omari
Slide2Slide3ECG
Stands for electrocardiogram
( EKG ); it’s a record of the
heart’s
electrical activity
.
This activity recorded in a form of waves ,
each wave has its own characteristic Electrical activity means the depolarization and repolarization of the myocardium
Slide4ECG contains 12 leads :
6
chest leads ( V1 , V2
,
V3
,
V4 ,V5
,
V6 )3 arm leads ( I ,II , III )3 augmented limb leads ( aVL ,
aVR
,
aVF
.)
Slide5Slide6Slide7Slide8Slide9Slide10Slide11Slide12V1,,,,,,,,,,,,,,,,,,,,,,,,,,,,,,,,,V6
Slide13V1, V2, V3, V4:
Anteriospetal surface
.V5,V6: Lateral surfaceIn a normal cardiac axis (about 60 degrees):
V1: Small R, Deep S
V2: R increases, S decreases
V3/V4: R=S
V5/V6: Large R, S disappears in normal people
If the R is poorly enlarging (poor progression R wave
= sign of ischemia)
Slide146 limb leads:
I between
right arm and left arm.
II between
right
arm and
left
leg.
III between left arm and left leg.aVR
: right arm,
aVL
:
left arm,
aVF
: left leg
I,
aVL
: Left lateral surface.
II ,III ,
aVF
: Inferior surface.
aVR
: Right surface.
Slide1566
Slide16Positive deflection
: If a wave of depolarization passing through the heart is moving toward a surface electrode
Negative deflection: If a wave of depolarization passing through the heart is moving away from the electrode.
Biphasic wave
: If a wave of depolarization passing through the heart is moving
perpendicularly to the electrode.
Slide17Slide18Cardiac axis Normally
, between -30 and +90
Slide196
Slide20RIGHT axis deviation
Slide21causes of right axis deviation
Normal finding in children and tall thin adults
Right ventricular hypertrophyChronic lung disease even without pulmonary hypertensionAnterolateral
myocardial infarction
Left posterior
hemiblock
??
Pulmonary embolusWolff-Parkinson-White syndrome - left sided accessory pathway ??
Atrial
septal
defect
ostium
secondum
Ventricular
septal
defect
Slide22Slide23LEFT axis deviation
Slide24Causes of left axis deviation
Left anterior fascicular block
Left bundle branch blockLeft ventricular hypertrophyInferior MIVentricular ectopic
Paced rhythm
Wolff-Parkinson White syndrome in
Rt
sided accessory pathway
Slide25Slide26No Man’s land
Indeterminate Axis
Northwestern axis
Lead
I ,II , III : negatives
Causes : seen in ventricular rhythm ,
dextrocardia
Extreme axis
Slide28Standard ECG
The quality of an ECG is determined by the presence of
PATIENT’S NAME, DATE/TIME, the 12 LEADS and a RYTHEM STRIP at the bottom.The paper moves in a speed of
25mm/s (horizontal) =
And a calibration of 1cm or
10mm/mV (vertical).
1 small square = 1 mm, 1 large square = 5 small square = 5 mm.
So each small square represent time horizontally and voltage vertically
So the paper of the ECG move 5 large square /s = 25 small square/s = 300 large square / min = 1500 small square / min Each large square width
represents
=
.2
second = 200 ms
Each
small square width
represent
=
.04
= 40 ms
Each
small square
hight
represents
.
1
mv
,
So
1mv needs 2 large square
Slide29Slide30Basics of the ECG
Slide316
Slide32Slide33Electrical activity for each cardiac cycle ( systole and diastole ) makes :
P:
Atria Depolarization (<2.5 mm vertical)QRS:
Ventricular Depolarization
T:
Ventricular
Repolarization
U:
Repolarization of the papillary muscles follows the T wave. (Normal or Abnormal)PR interval: 120-220 ms (3-5 small squares)>220: Block,
<120: accessory pathway
QRS complex: 120 ms (3 small squares)
Slide34Slide35Slide36Slide37Slide38Waves changes
P wave :
Absent p wave : not sinus rhythm P pulmonale
:
more than 3mm
hight
P
mitral : more than
3 mm width Inverted p wave : junctional
Slide39QRS
Generally duration less than 120 ms ( less than 3 small square )
If > 120 it is bundle branch block either partial if it is < 160 or complete if it is > 160 Accepted Q waves: V1,
aVR
and III
Negative in V1 ,
aVR
. Normally
Pathological Q wave should be more than 1 small square height and width and / or more than 25 % of the corresponding R waveV1-V6: R increases and S decreases (disappears in V6)
Slide40LVH sign
Sum of the S wave (-
ve deflection) in V1 and the biggest R wave in V5 or V6 >35mm = Left Ventricular Hypertrophy (LVH)
Slide41Slide42LBBB
QRS > 3
SsqRSR (M shaped QRS complex) in V5, V6, I and
deep S in V1
Usually associated with LAD
Slide43LBBB
Slide44Slide45RBBB
QRS > 3 Ssq
RSR (M shaped QRS complex) in V1, V2 and deep S in V6.
Slide46RBBB
Slide47Slide48Pre-excitation
syndromes (WPW Syndrome):
Preexcitation is a condition characterized by an accessory pathway of conduction,
which allows the heart to depolarize in an atypical sequence.
In Wolfe-Parkinson-White (WPW) syndrome, there’s a direct
atrioventricular
connection allows the ventricles to begin depolarization while the standard action potential is still traveling through the AV node.
Slide49Slide50Slide51Slide52ECG Characteristics of WPW:
1. Short PR interval
2. QRS prolongation3. Delta Wave 4. Followed by tachycardia
Slide53Slide54T - Wave
Peaked in young adult and hyper k
Inverted in ischemiaSmall in hypokalemia
Slide55Slide56Intervals – PR
From the beginning of the P wave to the beginning of the QRS = 160 ms to 220 ms
It is the iso- electrical line for the ECG Shortened
in WPW syndrome or normally with tachycardia
Prolongation
= heart block ( 3 degrees )
Slide571st degree Heart block:
Prolongation of the PR interval, which is constant
All P waves are conducted
Slide582nd degree Heart block
(
Mobitz 1)/Wenckebach:Progressive prolongation of the PR interval until a P wave is not conducted.
Slide592nd degree Heart block
(
Mobitz 2):Constant PR interval with intermittent failure to conduct
Slide60Mobitz 2 HB
Slide61Third degree Heart block
(Complete):
No relationship between P waves and QRS complexes,Relatively constant PP intervals and RR intervals and Greater number of P waves than QRS complexes
Slide62Slide63Slide64QT interval
From the beginning of the QRS to the beginning of the T wave
Variable duration in response to the heart rate Prolonged QT interval carries high risk of arrhythmia (torsades de pointes )
Slide65Slide66Long QT syndrome causes
> 450 ms
Congenital ( romano ward syndrome , jervell
and Lang-Nielsen )
Drugs :
class 3 and class 1 a
antiarrhythmic
,
antimalrial chloroquine , tricyclic antidepressants , terfenadine , antibiotics ( macloride- erythromycin ,
floroquinilone
)
Hypo ( ca , mg , k )
Hypothermia
Myocarditis
Subarachnoid hemorrhage
Slide67St segment
ST depression:
Downsloping or horizontal = abnormalIschaemia
(coronary
stenosis
):
Chest pain association
If lateral (V4-V6),
consider LVH with ‘strain’ or digoxin toxicity
Slide68Slide69Slide70ST segment elevation
Slide71Takotsubo cardiomyopathy
Slide72Slide73Slide74Slide75Slide76Slide77Slide78Slide79Atrial and Ventricular
Arrythmias
Bradycardia : HR less than 60 Tachycardia : HR > 100 Supraventricular
arrythmia
: SA , Atria , AV
Slide80SVT (Supraventricular
Tachycardia):
Narrow QRS, Rate >150, regular RR complexes, P wave may be superimposed on T wave or hidden inside the QRS complex
Slide81Slide82Atrial Flutter:
Biphasic “
sawtooth” flutter waves at a rate of >250/minFlutter waves have constant amplitude, duration, and morphology through the cardiac cycle.
There is usually either a 2:1 or 4:1 block at the AV node, resulting in ventricular rates of either 150 or 75
bpm
Adenosine is used to unmask an unclear record (SVT or Flutter?) by showing the saw-tooth appearance.
Slide83Slide84Atrial Fibrillation
Atrial
fibrillation is caused by numerous wavelets of depolarization spreading throughout the atria simultaneously, leading to an absence of coordinated atrial
contraction.
AF is important because it can lead to: Hemodynamic compromise, Systemic
embolization
and other Symptoms
On ECG
: Absent P waves , Irregularly irregular ventricular response and tachycardiac
Slide85Slide86Causes of irregular pulse
Sinus arrhythmia
Atrial extra systole Ventricular extra systole Atrial fibrilation
Atrial
flutter with variable response
Second degree heart block with variable response
Multifocal
atrial tachycardia ( MAT )
Slide87AF causes
HTN
IHD Mitral valve disease HF Thyrotoxicosis Alcohol
Infection : pneumonia
Pul
. Embolism
Post cardiac surgery
Idiopathic ( lone AF )
Slide88Ventricular Tachychardia
(usually follows MI)
Broad bizzare QRS complex - Regular RR wavesRate >120 (less than the SVT)P waves are present, fused with T or on top of ascending QRS complexes
Captured beat & fusion beat
Slide89Slide90Slide91Slide92Slide93Slide94Slide95Ectopic Beats
Abnormal early beat whether
atrial or ventricular within a normal ECGIn ventricular extrasystole
/ectopic beat : QRS would look broad and bizarre, not
preceeded
by P and followed by opposing ST-T changes and by a
compnesatory
pause.
In Atrial extrasystole/ectopic beat: QRS would look normal, abnormally looking P wave and with a compnesatory pause.
Slide96Slide97Multifocal Atrial
Tachycardia:
Discrete P waves with at least 3 different morphologies. Atrial rate > 100 bpm
.
The PP, PR, and RR intervals all vary.
It’s very common
with COPD and Lung fibrosis patients.
Slide98Slide99ECG and electrolytes
Potasium
Slide100Interpretation
Name of the pt
Calibration Rhythm sinus or not Rate normal , brady ,
tachy
Regularity
Axis
P wave and PR interval best seen at lead II
QRS shape , width , progression , T wave : shape , inversion , Most important : ST segment for depression and elevation The presence of pathological Q wave Don’t forget the artifact changes in the ECG mainly the limb opposition
Slide101Slide102