/
Air Masses and Fronts Source regions for North American Air Masses and Fronts Source regions for North American

Air Masses and Fronts Source regions for North American - PowerPoint Presentation

pamela
pamela . @pamela
Follow
27 views
Uploaded On 2024-02-03

Air Masses and Fronts Source regions for North American - PPT Presentation

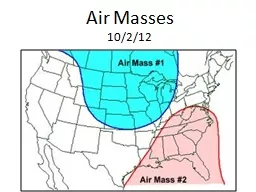
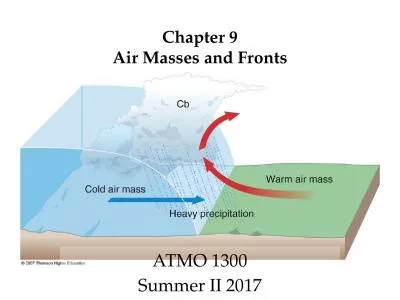
air masses An Air Mass is an immense body of air some 1600 km 1000mi across and 13 km 6 to 19mi thick with relatively homogeneous physical properties density T and moisture at a given altitude ID: 1044260

front air warm cold air front cold warm fronts mass weather masses clouds latitude cyclone polar occluded warmer view

Share:

Link:

Embed:

Download Presentation from below link

Download Presentation The PPT/PDF document "Air Masses and Fronts Source regions for..." is the property of its rightful owner. Permission is granted to download and print the materials on this web site for personal, non-commercial use only, and to display it on your personal computer provided you do not modify the materials and that you retain all copyright notices contained in the materials. By downloading content from our website, you accept the terms of this agreement.


Presentation Transcript

1. Air Masses and Fronts

2. Source regions for North American air masses. An Air Mass is an immense body of air, some 1600+ km (~1000mi) across and 1-3 km (~.6 to 1.9mi) thick, with relatively homogeneous physical properties (density, T and moisture) at a given altitude.

3. Classification Scheme of air masses is based on the basic T° and moisture (water vapor content or humidity) conditions of the air. A two-letter abbreviation system is used to indicate the various types of air masses. The First letter is a reference to the surface over which the air mass develops and thus the level of moisture, dry vs. humid. Lower-case letters are use and c=Continental or dry air and m=Maritime or humid air.The Second letter is a reference to the latitude of origin and thus the T, cold vs. warm. Upper-case letters are used and A=Arctic (bitterly cold), P=Polar (cold to very cold), T=Tropical warm), E=Equatorial (very warm). (E air masses are only found in tropical latitudes and not in North America.)

4. The Source Region in which an air mass originates determines the initial characteristics of the air mass,cold vs. warm, dry vs. humid(Polar), (Tropical), (Land), (Water) Keep in mind that cold and warm are relative terms. For example, a cold air mass in winter may be 20° F, but a cold air mass in summer may be 70° F.

5.

6. A cold cP air mass dominates the upper Midwest as indicated by the area of high pressure and low T°s (the upper-left number next to the dot or station model, like the 5 right below the first H in HIGH which represents a T° of 5° F).

7. Source: US Dept. of Commerce, National Oceanic and AtmosphericAdministration, National Weather Service.

8. Warm, moist mT air masses from the Gulf of Mexico and the Atlantic Ocean greatly affect RH and precipitation patterns in the southeastern and eastern USA.

9. The term Fronts refers to the invisible boundary separating air masses of different characteristics, primarily temperature (warm vs. cold) and humidity (dry vs. humid). The Arctic and Polar fronts shown in cross-section. The Arctic front is not as expansive or thick as the Polar front, and thus has less influence on mid-latitude weather.

10. Cross-sectional view of Earth’s planetary wind pattern and the Polar front.

11. The term wave cyclone refers to a weather pattern which may develop in conjunction with or along the polar front. It can be represented by the idealized diagram shown here which consists of a low-pressure cell and a cold front and warm front. This the primary structure of aMid-Latitude Wave Cyclone.Cool

12. Four types of fronts and the associated weather map symbols. (Be sure you know what these look like, whether in color or not.)

13. Cross-sectional view of a typical cold front. A Cold Front is the boundary at the forward edge of an advancing cold air mass that is displacing warmer air. Cumulus and cumulonimbus clouds are typically associated with cold fronts thus quite often more violent weather is associated with cold fronts. The warmer air is ahead of the cold front symbol (the line of triangles) and the colder air is behind it. The symbols, triangles, point in the direction the cold air is going. In the diagram above the cold air mass is moving left to right. Cold fronts and air masses travel at an average of approximately 25-35 mph forward speed.

14. Satellite view of a cold front and associated cloud formation and thunderstorms. The colder air is to the upper-left and the warmer air to the lower-right.

15. This slide and the next two illustrate the change in T° as a cold front passes.

16.

17.

18. Cold fronts have steep leading edges due to friction slowing down the air near the surface and the air aloft moving faster with less friction. This causes the warmer air to be lifted more violently and thus form cumulonimbus clouds.

19. Cross-sectional view of a typical warm front. A Warm Front is the boundary at the forward edge of an advancing warm air mass that is displacing cooler air. Stratus and nimbostratus clouds are usually associated with warm fronts and thus less severe weather is associated with warm fronts.The cooler air is ahead of the warm front symbol (the line of half circles) and the warmer air is behind it. The symbols, half circles, point in the direction the warm air is going. In the diagram above the warm air mass is moving left to right. Warm fronts and air masses travel at an average of approximately 15-20 mph forward speed.

20. Illustration of a warm front. The warm air behind the front is slowly overtaking the cooler air ahead of the front, which is moving more slowly in the same direction. The warmer air, due to lower density, climbs slowly over the cooler air as it moves. As a result of its increased altitude, it cools off and its moisture condenses, forming clouds and possibly precipitation, but less violent stratus and nimbostratus clouds.

21. An overhead or top-down view of a warm front as it might appear on a weather map.

22. Satellite view of a cold front (center) and warm front (upper right).

23. Radar image of the same situation from the previous slide. The cold front has red- and orange-colored clouds indicating cooler temperatures thus higher cloud tops.

24. This shows three consecutive days of a mid-latitude wave cyclone as it moves across North America. Each weather map on the left is paired with an enhanced (colorized) satellite image for the same day and time.

25. An Occluded Front refers to a situation when a cold front has overtaken a warm front. Stratus and nimbostratus clouds are usually associated with occluded fronts and thus less severe weather.An occluded front forms as the cold front catches to and overtakes the warm front. This is known as occlusion. (Remember that cold fronts typically travel at ~30mph forward speed, while warm fronts travel at ~20mph.)In this diagram of a mid-latitude wave cyclone the cold front begins to overtake the warm front starting near the center of the low-pressure cell. This continues essentially closing the space between the two fronts like closing a zipper.

26. An occluded front is formed from the “collapsing” of a mid-latitude wave cyclone because the cold front moves faster than the warm front.

27. As the cold front “catches up to” and overtakes the warm frontthe warm air is lifted off the ground and occlusion has begun.

28. Occlusion continues as the cold front proceeds to push all the warm air off the surface until the system has used all its energy and begins to dissipate.

29. Again, remember the four types of fronts and the associated weather map symbols. Note the difference between the stationary and occluded fronts. The stationary front has one symbol on one side and the one symbol on the other side, while an occluded front has both symbols on the same side.

30. An idealized Mid-Latitude Wave Cyclone with it associated cold front and warm front.Cool