/
Automated Diagnosis of Chronic Problems in Production Syste Automated Diagnosis of Chronic Problems in Production Syste

Automated Diagnosis of Chronic Problems in Production Syste - PowerPoint Presentation

pamella-moone
pamella-moone . @pamella-moone
Follow
450 views
Uploaded On 2016-06-30

Automated Diagnosis of Chronic Problems in Production Syste - PPT Presentation

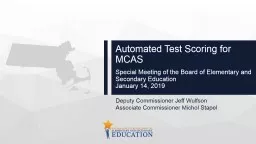
Soila Kavulya Thesis Committee Christos F aloutsos CMU Greg Ganger CMU Matti Hiltunen ATampT Priya Narasimhan CMU Advisor Outline Motivation Thesis Statement ID: 383283

2012 kavulya march soila kavulya 2012 soila march hadoop problems anomaly diagnosis performance amp detection systems peer production node

Share:

Link:

Embed:

Download Presentation from below link

Download Presentation The PPT/PDF document "Automated Diagnosis of Chronic Problems ..." is the property of its rightful owner. Permission is granted to download and print the materials on this web site for personal, non-commercial use only, and to display it on your personal computer provided you do not modify the materials and that you retain all copyright notices contained in the materials. By downloading content from our website, you accept the terms of this agreement.


Presentation Transcript

Slide1

Automated Diagnosis of Chronic Problems in Production Systems

Soila Kavulya

Thesis Committee

Christos

F

aloutsos

,

CMU

Greg Ganger,

CMU

Matti

Hiltunen

,

AT&T

Priya

Narasimhan

,

CMU (Advisor)Slide2

Outline

Motivation

Thesis Statement

ApproachEnd-to-end trace constructionAnomaly detectionLocalizationEvaluationVoIPHadoopCritique & Related WorkPending Work

Soila Kavulya @ March 2012

2Slide3

Motivation

Chronics

are problems that areNot transientNot resulting in system-wide outageChronics occur in real production systemsVoIPUser’s calls fail due to version conflict between user and upgraded serverHadoop

(CMU’s OpenCloud

)

A user job sporadically fails in map phase with cryptic block I/O error

User and admins spend 2 months troubleshootingTraced to large heap size in tasktracker starving collocated datanodesChronics are due to a variety of root-causesConfiguration problems, bad hardware, software bugsThesis: Automate chronics diagnosis in production systems

Soila Kavulya @ March 2012

3Slide4

C

hallenge for Diagnosis

Soila Kavulya @ March 2012

4

D

ue

to single

node?

D

ue

to complex

interactions between nodes?

D

ue

to multiple independent

node?

Node1

Single manifestation, multiple possible causes

Node2

Node3

Node4

Node5Slide5

Challenges in Production Systems

Labeled failure-data is not always available

Difficult to diagnose problems not encountered before

Sysadmins’ perspective may not correspond to users’ No access to user configurations, user behaviorNo access to application semanticsFirst sign of trouble is often a customer complaintCustomer complaints can be crypticDesired level of instrumentation may not be possibleAs-is vendor instrumentation with limited control

Cost of added instrumentation may be highGranularity of diagnosis consequently limited

Soila Kavulya @ March 2012

5Slide6

Outline

Motivation

Thesis Statement

ApproachEnd-to-end trace constructionAnomaly detectionLocalizationEvaluationVoIPHadoopCritique & Related WorkPending Work

Soila Kavulya @ March 2012

6Slide7

Objectives

“Is there a problem?”

(

anomaly detection)Detect a problem despite potentially not having seen it beforeDistinguish a genuine problem from a workload change“Where is the problem?” (localization)Drill down by analyzing different instrumentation perspectives “What kind of problems?” (chronics)Manifestation: exceptions, performance degradationsRoot-cause: mis

configuration, bad hardware,

bugs, contention

Origin: single/multiple independent sources, interacting sources

“What kind of environments?” (production systems)Production VoIP system at AT&T Hadoop: Open-source implementation of MapReduceSoila Kavulya @ March 20127Slide8

Thesis Statement

P

eer

-comparison* enables anomaly detection in production systems despite workload changes, and the subsequent incremental fusion of different instrumentation sources enables localization of chronic problems.Soila Kavulya @ March 2012

8

*Comparison of some performance metric across similar (peer) system elementsSlide9

9

rika

(Swahili),

noun

. peer, contemporary, age-set, undergoing rites of passage (marriage) at similar times.

What was our Inspiration? Slide10

What is a

P

eer

?Temporal similarityAge-set: Born around the same timeAnomaly detection: Events within same time windowSpatial similarityAge-set: Live in same locationAnomaly detection: Run on same nodePhase similarityAge-set: (birth, initiation, marriage)Anomaly detection: (map, shuffle, reduce)Contextual similarity

Age-set: Same gender, clanAnomaly detection: Same workload, h/w

Soila Kavulya @ March 2012

10Slide11

Target Systems for Validation

VoIP

system at large telecommunication provider

10s of millions of calls per day, diverse workloads100s of network elements with heterogeneous hardware24x7 Ops team uses alarm correlation to diagnose outagesSeparate team troubleshoots long-term chronicsLabeled traces availableHadoop: Open-source implementation of MapReduce

Diverse kinds of real workloads

Graph mining, language translation

Hadoop

clusters with homogeneous hardwareYahoo! M45 & Opencloud production clustersControlled experiments in Amazon EC2 clusterLong running jobs (> 100s): Hard to label failuresSoila Kavulya @ March 201211Slide12

In Support of Thesis Statement

Soila Kavulya @ March 2012

12

OBJECTIVEVoIPHADOOP

Anomaly

Detection

Heuristics-based,

peer-comparison pendingPeer comparison without labeled dataProblem LocalizationLocalize to customer/network-element/resource/error-codeLocalize to node/task/resourceChronics

Exceptions, performance degradation, single/multiple-source

Exceptions, performance degradation, single-source

multiple-source pending

Production Systems

AT&T production system

EC2 test

system,

OpenCloud

pending

Publications

OSR’11, DSN’12

WASL’08, HotMetrics’09, ISSRE’09, ICDCS’10, NOMS’10,

CCGRID’10Slide13

Outline

Motivation

Thesis Statement

ApproachEnd-to-end trace constructionAnomaly detectionLocalizationEvaluationVoIPHadoopCritique & Related WorkPending Work

Soila Kavulya @ March 2012

13Slide14

Goals & Non-Goals

Goals

Anomaly detection in the absence of labeled failure-data

Diagnosis based on available instrumentation sourcesDifferentiation of workload changes from anomaliesNon-goalsDiagnosis of system-wide outagesDiagnosis of value faults and transient faultsRoot-cause analysis at code-levelOnline/runtime diagnosisRecovery based on diagnosisSoila Kavulya @ March 2012

14Slide15

Assumptions

Majority

of system is working

correctlyProblems manifest in observable behavioral changesExceptions or performance degradationsAll instrumentation is locally timestamped Clocks are synchronized to enable system-wide correlation of dataInstrumentation faithfully captures system behavior

Soila Kavulya @ March 2012

15Slide16

Overview of Approach

Soila Kavulya @ March 2012

16

End-to-endTraceConstruction

Performance

Counters

Application

LogsRanked list of root-causes

Anomaly Detection

Localization Slide17

Target System #1: VoIP

Soila Kavulya @ March 2012

17

PSTN Access

IP Access

Gateway

Servers

IP Base

Elements

Application

Servers

Call Control

Elements

ISP’s networkSlide18

Target System

#2:

Hadoop

Soila Kavulya @ March 2012

18

JobTracker

NameNode

TaskTracker

DataNode

Map/Reduce tasks

HDFS

blocks

Master Node

Slave Nodes

Hadoop

logs

OS data

OS data

Hadoop

logsSlide19

Performance Counters

For both

Hadoop

and VoIPMetrics collected periodically from /proc in OSMonitoring interval varies from 1 sec to 15 minExamples of metrics collectedCPU utilizationCPU run-queue sizePages in/outMemory used/freeContext switchesPackets sent/receivedDisk blocks read/written

Soila Kavulya @ March 2012

19Slide20

End-to-End Trace Construction

Soila Kavulya @ March 2012

20

End-to-endTraceConstruction

Performance

Counters

Application

LogsRanked list of root-causes

Anomaly Detection

Localization Slide21

Application

Logs

Each node logs each request that passes through it

Timestamp, IP address, request duration/size, phone no., …Log formats vary across components and systemsApplication-specific parsers extract relevant attributes

Construction of end-to-end traces

Pre-defined schema used to stitch requests across nodes

Match on

key attributesIn Hadoop, match tasks with same task IDsIn VoIP, match calls with same sender/receiver phone noIncorporate time-based correlationIn Hadoop, consider block reads in same time interval as mapsIn VoIP, consider calls with same phone no. within same time intervalSoila Kavulya @ March 2012

21Slide22

Application Logs: VoIP

Soila Kavulya @ March 2012

22

Combine per-element logs to obtain per-call traces

Approximate match on key attributes

Timestamps, caller-

callee

numbers, IP, portsDetermine call status from per-element codesZero talk-time, callback soon after call terminationIP Base

Element

Call Control

Element

Application

Server

Gateway

Server

10:03:59, START

973-123-8888 to 409-555-5555

192.156.1.2 to 11.22.34.1

10:03:59, STOP

10:03:59, ATTEMPT

973-123-8888 to 409-555-5555

10:04:01, ATTEMPT

973-123-xxxx to 409-555-xxxx

192.156.1.2 to 11.22.34.1Slide23

Application Logs: Hadoop (1)

Peer-comparable attributes extracted from logs

Correlate traces using IDs and request schema

Soila Kavulya @ March 2012232009-03-06 23:06:01,572 INFO org.apache.hadoop.mapred.ReduceTask: attempt_200903062245_0051_r_000005_0 Scheduled 10 of 115 known outputs (0 slow hosts and 105 dup hosts)

2009-03-06 23:06:01,612 INFO

org.apache.hadoop.mapred.ReduceTask

: Shuffling 2 bytes (2 raw bytes) into RAM from attempt_200903062245_0051_m_000055_0 …from

ip-10-250-90-207.ec2.internalTemporal similarity: Timestamps

Hostnames: Spatial

similarity

Phase similarity: Map

Reduce

Context similarity:

TaskTypeSlide24

Application Logs: Hadoop (2)

No global IDs for correlating logs in

Hadoop

& VoIPExtract causal flows using predefined schemasSoila Kavulya @ March 201224

NoSQL

Database

2009-03-06 23:06:01,572 INFO

org.apache.hadoop.mapred.ReduceTask: attempt_200903062245_0051_r_000005_0 Scheduled 10 of 115 known outputs (0 slow hosts and 105 dup hosts)

Application logs

Extract

events

<time=t2,type=shuffle,

reduceid

=reduce1,mapid=map1,

duration=2s>

MapReduce

: {

“events” : { “Map” :

{ “primary-key” : “

MapID

”,

“join-key” : “

MapID

”,

“next-event” : “Shuffle”},…

Flow schema

(JSON)

Causal flowsSlide25

Anomaly Detection

Soila Kavulya @ March 2012

25

End-to-endTraceConstruction

Performance

Counters

Application

LogsRanked list of root-causes

Anomaly Detection

Localization Slide26

Anomaly Detection Overview

Soila Kavulya @ March 2012

26

Some systems have rules for anomaly detectionRedialing number immediately after disconnection

Server

reported error

codes and exceptions

If no rules available, rely on peer-comparisonIdentifies peers (nodes, flows) in distributed systemsDetect anomalies by identifying “odd-man-out”Slide27

Anomaly Detection (1)

Empirically determine best peer groupings

Window size, request-flow types, job information

Best grouping minimizes false positives in fault-free runsPeer-comparison identifies “odd-man-out” behaviorRobust to workload changesRelies on histogram-comparison Less sensitive to timing differencesMultiple suspects might be identifiedDue to propagating errors, multiple independent problemsSoila Kavulya @ March 201227Slide28

Anomaly Detection (2)

Soila Kavulya @ March 2012

28

Histogram comparison identifies anomalous flows

Generate aggregate histogram represents majority behavior

Compare each node’s histogram against aggregate histogram O(n)

Compute

anomaly score using Kullback-Leibler divergence Detect anomaly if score exceeds pre-specified thresholdFaulty node

Histograms (distributions) of

durations

of

flows

Normal node

Normal node

Normalized counts (total 1.0)

Normalized counts (total 1.0)

Normalized counts (total 1.0)Slide29

Localization

Soila Kavulya @ March 2012

29

End-to-endTraceConstruction

Performance

Counters

Application

LogsRanked list of root-causes

Anomaly Detection

Localization Slide30

“Truth table” Request Representation

Node1

Node2

Map

ReadBlock

Outcome

Req1

1

0

1

1

SUCCESS

Req2

0

1

1

1

FAIL

Soila Kavulya @ March 2012

30

Log Snippet

Req1: 20100901064914,SUCCESS,Node1,Map,ReadBlock

Req2: 20100901064930,FAIL,Node2,Map,ReadBlockSlide31

Identify Suspect Attributes

Assume each

attribute

represented as “coin toss”Estimate attribute distribution using BayesSuccess distribution: Prob(Attribute|Success) Anomalous distribution:

Prob(Attribute|Anomalous

)

Anomaly score: KL-divergence between the two distributions

http://www.pdl.cmu.edu/BeliefProbability(Node2=TRUE)

Successful requests

Anomalous requests

Indict attributes with highest divergence between

distributions

Soila Kavulya @ March 2012

31Slide32

Rank Problems by Severity

Soila Kavulya @ March 2012

32

ShuffleMap

Node3

Node2

Step 1: All

requests

Problem1:

Node2

Map

Shuffle

ExceptionX

ExceptionY

Node3

Step 2: Filter

all

r

equests except

those

matching Problem1

Problem2:

Node3

Shuffle

Indict path with highest anomaly score

350

120

670

90

290

450

160

340Slide33

Incorporate Performance Counters (1)

Annotate requests on indicted nodes with performance counters based on timestamps

Identify

metrics most correlated with problemCompare distribution of metrics in successful and failed requestsSoila Kavulya @ March 201233

Requests on node2

#

Timestamp,CallNo,Status,Memory

(%),CPU(%) 20100901064914, 1, SUCCESS, 54, 620100901065030, 2, SUCCESS, 54, 6 20100901065530, 3, SUCCESS, 56, 4 20100901070030, 4, FAIL, 52, 45 Slide34

Incorporate Performance Counters

(2)

Soila Kavulya @ March 2012

34Shuffle

Map

Node3

Node2

All

requests

Problem1:

Node2

Map

High CPU

High CPU

Incorporate performance counters in

diagnosis

350

120

670

90Slide35

Why Does It Work?

Real-world data backs up utility of peer-comparison

Task durations peer-comparable in >75% of jobs [CCGrid’10]

Approach analyzes both successful and failed requestsAnalyzing only failed requests might elevate common elements over causal elementsIterative approach discovers correlated attributesIdentifies problems due to conjunctions of attributes

Filtering step identifies multiple ongoing problemsHandles

unencountered

problemsDoes not rely on historical models of normal behaviorDoes not rely on signatures of known defectsSoila Kavulya @ March 201235Slide36

Outline

Motivation

Thesis Statement

ApproachEnd-to-end trace constructionAnomaly detectionLocalizationEvaluationVoIPHadoopCritique & Related WorkPending Work

Soila Kavulya @ March 2012

36Slide37

VoIP: Diagnosis of Real Incidents

Soila Kavulya @ March 2012

37

Examples of real-world

incidents

Diagnosed

Resource

Indicted

Customers use wrong codec to send faxes

NA

Customer problem causes blocked calls at IPBE.

NA

Blocked circuit identification codes on trunk group

NA

Software bug at control server causes blocked calls

NA

Problem with customer equipment leads to poor

QoS

NA

Debug

tracing overloads

servers during peak traffic.

CPU

Performance problem at application server.

CPU/Memory

Congestion at gateway servers due to high load

CPU/Concurrent Sessions

Power outage and causes brief outages.

NA

PSX not responding to invites from app. server

Low responses at app. server

8 out of 10 real incidents diagnosedSlide38

Day1

Day2

Day3

Day4

Day5

Day6

Day1

Day2

Day3

Day4

Day5

Day6

VoIP: Case Studies

Soila Kavulya @ March 2012

38

Incident 1: Chronic due to unsupported fax codec

Failed calls for two customers

Failed calls for server

Customers stop using unsupported codec

Chronic nightly problem

Unrelated chronic server problem emerges

Server reset

Incident 2: Chronic server problemSlide39

Implementation

of

Approach

Draco: Deployment in Production at AT&Thttp://www.pdl.cmu.edu/39

1

. Problem1

STOP.IP-TO-PS.487.3

STOP.IP-TO-PSTN.41.0.-.-Chicago*GSXServersMemoryOverload2. Problem2STOP.IP-TO-PSTN.102.0.102.102ServiceB

CustomerAcme

IP_w.x.y.z

Search

Filter

~8500 lines of C code

Soila Kavulya @ March 2012Slide40

VoIP: Ranking Multiple Problems

Soila Kavulya @ March 2012

40

Draco performs better at ranking multiple independent problemsSlide41

VoIP: Performance of Algorithm

Offline Analysis

Avg.

Log SizeAvg. Data Load Time

Avg.

Diagnosis Time

Draco simulated-1hr

(C++)271 MB8s4sDraco real-1day(C++) 2.4 G7min

8min

Soila Kavulya @ March 2012

41

Running

on 16-core Xeon (@ 2.4GHz), 24 GB MemorySlide42

Outline

Motivation

Thesis Statement

ApproachEnd-to-end trace constructionAnomaly detectionLocalizationEvaluationVoIPHadoopCritique & Related WorkPending Work

Soila Kavulya @ March 2012

42Slide43

Hadoop: Target Clusters

10

to

100-node Amazon’s EC2 clusterCommercial, pay-as-you-use cloud-computing resourceWorkloads under our control, problems injected by usgridmix, nutch, sort, random writer

Can harvest logs and OS data of only our

workloads

4000

-processor M45 & 64 node Opencloud clusterProduction environment Offered to CMU as free cloud-computing resourceDiverse kinds of real workloads, problems in the wildMassive machine-learning, language/machine-translationPermission to harvest all logs and OS dataSoila Kavulya @ March 201243Slide44

Hadoop

: EC2 Fault Injection

Soila Kavulya @ March 2012

44

Fault

Description

Resource contention

CPU hog

External process uses 70% of CPU

Packet-loss

5% or 50% of incoming packets dropped

Disk hog

20GB file repeatedly written to

Application bugs

Source:

Hadoop

JIRA

HADOOP-1036

Maps hang due to unhandled exception

HADOOP-1152

Reduces fail while copying map output

HADOOP-2080

Reduces fail due to incorrect

checksum

Injected fault on single nodeSlide45

Metrics

True Positive Rates

Different metrics detect different problems

Hadoop

: Peer-comparison Results

Soila Kavulya @ March 2012

45

Without Causal FlowsCorrelated problems (e.g., packet-loss) harder to localizeSlide46

Hadoop: Peer-comparison Results

Soila Kavulya @ March 2012

46

With Causal Flows + Localization

Examples of real-world

incidents

Diagnosed

Metrics Indicted

CPU hog

Node

Packet-loss

Node+Shuffle

Disk hog

Node

HADOOP-1036

Node+Map

HADOOP-1152

Node+Shuffle

HADOOP-2080

Node+Shuffle

Correlated problems correctly identifiedSlide47

Outline

Motivation

Thesis Statement

ApproachEnd-to-end trace constructionAnomaly detectionLocalizationEvaluationVoIPHadoopCritique & Related WorkPending Work

Soila Kavulya @ March 2012

47Slide48

Critique of Approach

Anomaly detection thresholds are fragile

Need to use statistical

testsAnomaly detection does not address problems at masterPeer-groups are defined staticallyAssumes homogeneous clustersNeed to automate identification of peersFalse positives occur if root-cause not in logsAlgorithm tends to implicate adjacent network elementsNeed to incorporate more data to improve visibilitySoila Kavulya @ March 201248Slide49

Related Work

Chronics

fly under the radar

Undetected by alarm mining [Mahimkar09]Chronics can persist undetected for long periods of timeHard to detect using change-points [Kandula09]Hard to demarcate problem periods [Sambasivan11]

Multiple ongoing problems at a time

Single fault assumption inadequate

[Cohen05,

Bodik10]Peer-comparison on its own inadequate Hard to localize propagating problems [Kasick10,Tan10,Kang10]Soila Kavulya @ March 201249Slide50

Outline

Motivation

Thesis Statement

ApproachEnd-to-end trace constructionAnomaly detectionLocalizationEvaluationVoIPHadoopCritique & Related WorkPending Work

Soila Kavulya @ March 2012

50Slide51

Pending Work

Soila Kavulya @ March 2012

51

OBJECTIVEVoIPHADOOP

Anomaly

Detection

Heuristics-based,

peer-comparison pendingPeer comparison without labeled dataProblem LocalizationLocalize to customer/network-element/resource/error-codeLocalize to node/task/resourceChronics

Exceptions, performance degradation, single/multiple-source

Exceptions, performance degradation, single-source

multiple-source pending

Production Systems

AT&T production system

EC2 test

system,

OpenCloud

pending

Publications

OSR’11, DSN’12

WASL’08, HotMetrics’09, ISSRE’09, NOMS’10,

CCGRID’10Slide52

Pending Work: Details

OpenCloud

production cluster & multiple-source problems [April-June 2012]64-node cluster housed at Carnegie MellonObtained and parsed logs from 25 real OpenCloud incidents Root-causes include misconfigurations, h/w issues, buggy appsYet to analyze logsPeer comparison in VoIP [June-July 2012]Examining data that is not labeled, and identifying peersNotion of a peer might be determined by function and location Root-causes under investigation are as beforeDissertation writing [June-August 2012]Defense [September 2012]

Soila Kavulya @ March 2012

52Slide53

Collaborators & Thanks

VoIP (AT&T)

Matti

Hiltunen, Kaustubh Joshi, Scott DanielsHadoop diagnosisJiaqi Tan, Xinghao Pan, Rajeev Gandhi, Keith Bare, Michael Kasick, Eugene MarinelliHadoop visualizationChristos Faloutsos, U Kang, Elmer Garduno, Jason Campbell (Intel), HCI 05-610

teamOpenCloudGreg Ganger, Garth Gibson, Julio

Lopez, Kai

Ren

, Mitch Franzos, Michael StrouckenSoila Kavulya @ March 201253Slide54

Summary

Peer-comparison effective for anomaly detection

Robust to workload changes

Requires little training dataIncremental fusion of different instrumentation sources enables localization of chronicsStarts with user-visible symptoms of a problemDrills down to localize root-cause of problemUsefulness of approach in two production systemsVoIP system at large telecommunication provider (demonstrated)Hadoop clusters (underway)Soila Kavulya @ March 2012

54Slide55

Soila Kavulya @ March 2012

55

Questions?

Climbing Mt. Kilimanjaro comes a distant second to a thesis proposal! Slide56

Selected Publications (1)

Diagnosis

in

Production VoIP systemDSN12: Draco:

Statistical

Diagnosis

of Chronic Problems in Large Distributed Systems. S. P. Kavulya, S. Daniels, K. Joshi, M. Hiltunen, R. Gandhi, P. Narasimhan. To appear DSN 2012.

OSR12: Practical

Experiences with Chronics Discovery in Large

Telecommunications Systems.

S

.

P. Kavulya, K.

Joshi

, M. Hiltunen, S. Daniels, R. Gandhi, P.

Narasimhan

.

Best

Papers from SLAML 2011 in Operating Systems Review,

2011

.

Survey Paper &

Workload

Analysis

of Production

Hadoop Cluster

RAE12: Failure

Diagnosis of

Complex

Systems S. P. Kavulya, K. Joshi, F. Di

Giandomenico, P. Narasimhan

. To appear

in Book on Resilience

Assessment

and

Evaluation

.

Wolter, 2012

.

An

analysis

of

traces

from a

production

MapReduce

cluster.

S. Kavulya, J. Tan, R. Gandhi, P.

Narasimhan

.

CCGrid

2010

.

Soila Kavulya @ March 2012

56Slide57

Selected Publications (2)

Visualization

in

HadoopCHIMIT11: Understanding and improving the diagnostic workflow

of

MapReduce

users. J. D. Campbell, A. B. Ganesan, B. Gotow, S. P. Kavulya, J. Mulholland, P. Narasimhan, S. Ramasubramanian, M. Shuster, J. Tan. CHIMIT 2011ICDCS10: Visual, log-based causal

tracing

for

performance

debugging

of

MapReduce

systems. J. Tan, S. Kavulya, R. Gandhi, P.

Narasimhan

. ICDCS 2010

Diagnosis

in

Hadoop

(

Application logs + performance

counters)

NOMS10: Kahuna: Problem Diagnosis

for MapReduce-Based Cloud

Computing Environments. J. Tan, X. Pan, S. Kavulya, R. Gandhi, P. Narasimhan

. NOMS 2010. ISSRE09: Blind Men and the

Elephant (BLIMEy

): Piecing

together Hadoop

for Diagnosis. X. Pan, J. Tan, S. Kavulya, R. Gandhi, P.

Narasimhan

.

ISSRE 2009

.

Soila Kavulya @ March 2012

57Slide58

Selected Publications (3)

Diagnosis

in

Hadoop (Performance counters)HotMetrics09: Ganesha

: Black-Box Fault

Diagnosis

for MapReduce Systems. X. Pan, J. Tan, S. Kavulya, R. Gandhi, P. Narasimhan. HotMetrics 2009. Diagnosis in Hadoop (Application logs)WASL: SALSA:

Analyzing Logs as

StAte

Machines. J. Tan, X. Pan, S. Kavulya, R. Gandhi. P.

Narasimhan

. WASL 2008,

Diagnosis

in

Group Communication Systems

SRDS08:

Gumshoe

:

Diagnosing

Performance

Problems in

Replicated

File

-Systems. S.

Kavulya, R. Gandhi, P. Narasimhan

. SRDS 2008.

SysML07: Fingerpointing Correlated

Failures in

Replicated Systems. S. Pertet, R. Gandhi, P. Narasimhan

. SysML,

April 2007. Soila Kavulya @ March 2012

58Slide59

Related Work (1)

[Bodik10

]:

Fingerprinting the datacenter: automated classification of performance crises. Peter Bodík, Moisés Goldszmidt, Armando Fox, Dawn B. Woodard, Hans Andersen: EuroSys 2010.[Cohen05]: Capturing, indexing, clustering and retrieving system history. Ira Cohen, Steve Zhang,

Moises Goldszmidt

, Julie Symons, Terence Kelly, Armando Fox. SOSP, 2005

.

[Kandula09]: Detailed diagnosis in enterprise networks. Srikanth Kandula, Ratul Mahajan, Patrick Verkaik, Sharad Agarwal, Jitendra Padhye, Paramvir

Bahl. SIGCOMM 2009.

[Kasick10]:

Black-Box Problem Diagnosis in Parallel File Systems.

Michael

P.

Kasick

,

Jiaqi

Tan, Rajeev Gandhi,

Priya

Narasimhan

.

FAST 2010.

[Kiciman05]:

Detecting application-level failures in component-based Internet Services.

Emre Kiciman, Armando Fox. IEEE Trans. on Neural Networks 2005.

Soila Kavulya @ March 2012

59Slide60

Related Work (2)

[

Mahimkar09]:

Towards automated performance diagnosis in a large IPTV network. Ajay Anil Mahimkar, Zihui Ge, Aman Shaikh, Jia Wang, Jennifer Yates, Yin Zhang, Qi Zhao. SIGCOMM

2009.[Sambasivan11]:

Diagnosing Performance Changes by Comparing Request Flows. Raja R.

Sambasivan

, Alice X. Zheng, Michael De Rosa, Elie Krevat, Spencer Whitman, Michael Stroucken, William Wang, Lianghong Xu, and Gregory R. Ganger. NSDI 2011.http://www.pdl.cmu.edu/Soila Kavulya @ March 201260