/
CORRELATIVE VIDEO-LIGHT ELECTRON MICROSCOPY  In studies of dynamic cel CORRELATIVE VIDEO-LIGHT ELECTRON MICROSCOPY  In studies of dynamic cel

CORRELATIVE VIDEO-LIGHT ELECTRON MICROSCOPY In studies of dynamic cel - PDF document

pamella-moone
pamella-moone . @pamella-moone
Follow
422 views
Uploaded On 2016-11-08

CORRELATIVE VIDEO-LIGHT ELECTRON MICROSCOPY In studies of dynamic cel - PPT Presentation

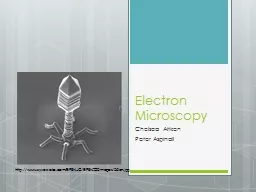
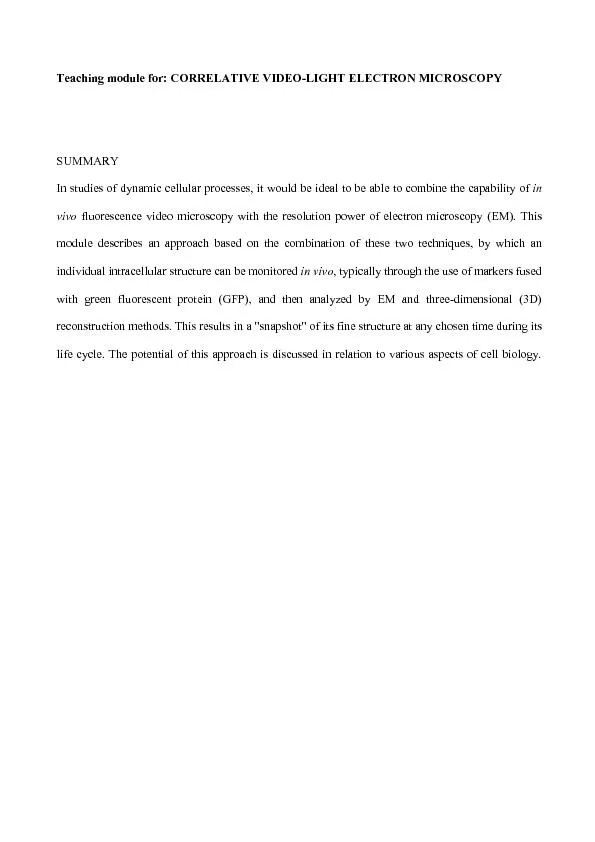
This module describes a newly developed method that allows the examination of living cells by timelapse analysis with the subsequent EM identification and examination of the particular ific moment i ID: 486075

This module describes newly

Share:

Link:

Embed:

Download Presentation from below link

Download Pdf The PPT/PDF document "CORRELATIVE VIDEO-LIGHT ELECTRON MICROSC..." is the property of its rightful owner. Permission is granted to download and print the materials on this web site for personal, non-commercial use only, and to display it on your personal computer provided you do not modify the materials and that you retain all copyright notices contained in the materials. By downloading content from our website, you accept the terms of this agreement.


Presentation Transcript

CORRELATIVE VIDEO-LIGHT ELECTRON MICROSCOPY In studies of dynamic cellular processes, it would be ideal to be able to combine the capability of in fluorescence video microscopy with the resolution power of electron microscopy (EM). This module describes an approach based on the combination of these two techniques, by which an individual intracellular structure can be monitored , typically through the use of markers fused with green fluorescent protein (GFP), and then analyzed by EM and three-dimensional (3D) reconstruction methods. This results cture at any chosen time during its life cycle. The potential of this approach is discussed in relation to various aspects of cell biology This module describes a newly developed method that allows the examination of living cells by time-lapse analysis, with the subsequent EM identification and examination of the particular ific moment in its life-cycle. Many cellular functions, such as intracellular traffic, cytokinesis and cell migration, crucially depend on rapid translocations and/or shape changes of specific intracellular organelles. To understand how such functions are organized and executed in vivo, it is important to be able to observe in real time in living cells such dynamic structures as a budding transpelongating microtubule or a developing mitotic spindle, with the degree of spatial resolution We describe here the most suitable method for this, which is conceptually simple, yet powerful, and which we have called correlative video-light EM (CVLEM). This indeed allows observations of the in vivo dynamics and ultrastructure of intracellular objects to be combined to achieve this result. We also illustrate the type of questions that the CVLEM approach was designed to address, as well as the particular know-how that is important for successful application of this The CVLEM procedure includes several stages (see Figure 1): A) observation of structures labelled with GFP in living cells; B) immunolabelling for EM, embedding, and identification of the cell on the resin block; C) cutting; D) EM analysis; and E) 3D reconstruction. During the first step, the cells are transfected with cDNA encoding the GFP fusion protein of choice, and the structure of interest is observed in the living cells. In this way, it is possible to gain information about its dynamic properties (e.g. motility, speed and direction, changes in size and shape). At the end of this stage, it is necessary to kill the cells by the addition of fixative, and in this way to capture the fluorescent object at the moment of interest. As GFP is not visible under EM, immunostaining provides the possibility of identifying the GFP-labelled structure at the EM level. Here, we describe the immunogold and immunoperoxidase protocols used for staining for EM. The immunogold protocol (Burry et al., 1992) is suitable for the labelling of the large majority of antigens, while the immunoperoxidase protocol allows only the labelling of antigens residing within small membrane-enclosed compartments because the electron dense product of the peroxidase reaction tends to diffuse from the place of antibody binding (Brown and Farquhar, 1989; Deerinck et al., 1994). Once stained, the cells must be prepared for EM by traditional epoxy embedding, and the cell and structure of interest must be identified in sections under the EM. Finding an individual subcellular structure in single thin sections can be complex, or even impossible, simply because most of the cellular organelles are bigger than the thickness of the section and lie in a plane that is different from that of the section. So an the whole cell is required to identify the structure observed in vivo. An example of this identification procedure is given in Figure 3. Finally, the EM analysis of serial sections can be supported by high voltage EM tomography and/or digital 3D reconstruction. E. Digital 3D reconstruction. A. GFP-based time-lapse confocal B. Immunoperoxidase labelling and embedding in resin. C. Cutting of serial sections. resin block knife Figure 1. The CVLEM stages Materials Cells of interest MatTek petri dishes with CELLocate coverslip (MatTek Corporation, Ashland, MA, USA) 0.2 M HEPES buffer Dissolve 4.77 g of HEPES in 100 ml distille - 8% paraformaldehyde) Dissolve 4 g of paraformaldehyde powder in 50 ml HEPES buffer, stisolution to 60 °C. Add drops of 1 N NaOH until the solution clears. Add 1.25 ml 8% 4% paraformaldehyde Dissolve 4 g of paraformaldehyde powder in 100 ml HEPES buffer, stirring while heating the solution to 60°C. Add drops of 1 N NaOH until the solution clears. 100 ml phosphate-buffered saline (PBS) The Fab fragments of secondary antibodies conjugated with horse radish peroxidase (HRP) (Rockland, Gilbertsville, PA, USA) NANOGOLD conjugated Fab fragments of secondary antibodies (Nanoprobes Inc., Yaphank, NY, USA) 0.1 M TRIS-HCl buffer Dissolve 1.21 g TRIZMA base in 100 ml distiDiaminobenzidine (DAB) solution Dissolve 0.01 g DAB in 20 ml Gold-enhance mixture : Use the Gold-enhance kit from Nanoprobes with equal amounts of each of the four components (Solutions A, B, C and D); prepare about 40 µl of reagent per grid. (a convenient method is to use an equal number of drops from each bottle). a. First, mix Solution A (enhancer: green cap) and Solution B (activator: yellow cap) b. Wait 5 min. then Solution D (buffer: white cap), and mix. Dissolve 2.12 g sodium cacodylatein 100 ml distilled water; a es, Fort Washington, PA, USA) Potassium ferrocyanide To the same test tube, add 20 g EPON, 13.0 g DDSA and 11.5 g MNA. Heat the tube in an oven for 2-3 min at 60 °C and then vortex it well. Add 0.9 g of DMP-30 and immediately Pick-up loop (Agar, Cambridge, England) Slot grids covered with carbon-formvar supporting film (Electron Microscopy Sciences, Fort Washington, PA, USA) Plate the cells for CVLEM in a MatTek petri dish with a CELLocate coverslip attached to the bottom of it. The CELLocate coverslips contain an etched grid with coordinates, FP fusion protein using your method of choice. Find a transfected cell of interest, and determine its position on the CELLocate grid, as Draw the position of the cell on the map of the CELLocate grid (available from MatTek). Observe the GFP-labelled structures in this living cell on a confocal or light-microscope stage that allows the grabbing of a time-lapse series of images by the computer. f) At the moment of interest, add the fixative to the cell culture medium while continuing to grab images (the volume ratio of fixative:medium is 1:1). Fixation usually induces the e motion of labelled structures in the cell. Stop grabbing the time-lapse images and leave the cells in the fixative for 10 min. Wash the cells with 4% paraformaldehyde once, and then leave them in 4% paraformaldehyde for 30 min. Immunolabelling for electron miscroscopy. Wash the cells for 3x 5 min with PBS. Incubate the cells with blocking solution for 30 min. Wash the cells for 6x 2 min with PBS. Dilute the NANOGOLD conjugated Fab fragments of the secondary antibodies ~50 times in blocking solution and add it to the cells; incubate for 2 h. Wash the cells for 6x 2 min with PBS. Fix the cells for 5 min with 1% glWash the cells for 3x 5 min with PBS. Wash the cells for 3x 5 min in distilled water. Incubate the cells with freshly prepared gold-enhancement mixture for 6-10 min. Wash the cells for 3x 5 min with distilled water. Wash the cells for 3x 2 min with PBS. Incubate the cells with blocking solution for 30 min. Wash the cells for 6x 2 min with PBS. fragments of the secondary antibody for 2 h. Wash the cells for 6x 2 min with PBS. Fix the cells for 5 min with 1% glWash the cells for 3x 5 min with PBS. Wash the cells for 3x 2 min with PBS. Find the cell of interest again on the CELLocate grid and compare its pattern of GFP and EM labelling, which should be Incubate the cells in the 1:1 mixture of 2% OsO and 3% potassium ferrocyanide in 0.2 M Wash the cells once with distilled water. To dehydratation the cells, incubate them (in order) with the following ethanol solutions: 50% (once), 70% (once), 90% (once), 100% (3x); each for 10 min. Keep the cells in the mixture of Keep the cells in EPON at the room temperature for 1-2 h, and then leave the specimens After 12 h of polymerization of EPON, place a small droplet of fresh resin on the site where the examined cell is located (Figure 3C) and insert a resin cylinder (prepared before by polymerization of resin in a cylindrical mold) with a flat lower surface; leave the sample for an additional 18 h in an oven at 60 °C. Carefully pick up the resin block from the Petri dish and glass. This is easy to do by the gentle to and fro bending of the cylinder. If the glass with a coordinated grid cannot be detached from the cells in the resin, the resin should be placed in commercially available 30 – 60 min to remove glass remnants. Control the completeness of the glass dissolution under a stereomicroscope. After the complete removal of the glass, wash the sample in water. Wash the sample in water and leave it to dry. Trim the resin block into a pyramid of ~2x 2 mm in size with the cell of interest at its centre (Figure 3C). Put the holder into the ultratome such that the segment arc is inBring the sample as close asAlign the bottom edge of the pyramid parallel to the knife edge. Tilting the segment arc and the knife, adjust the bright gap between the knife edge and the surface of the sample. It has to be identical in width during the full up and down movement of the resin block. This will ensure that every point of the surface containing the cell of interest is the same distance from the knife edge. Turn the specimen holder 90° to the left or the right, and trim the edges of the resin block using a glass knife to form a narrow pyramid with its long axis parallel to the knife edge. m).Turn the specimen holder 90° back and lock it in exactly the same position as before (this is very important). Bring the specimen towards the knife again. When it very close, replace the glass knife with a diamond one. ng to the instructions with the ultratome (e.g. Leica). For the picking up of the sections, stop the motor and using two eyelashes divide the ith a perfect loop. Touch the surface of the water with the band of sections with the perfect loop in such a Raise the loop with the droplet of water with the sections on it and place it inside the tripod under the microscope. Take the slot grid coated with formvar (or preferaby butvar)/carbon supporting the film and gently touch the sections on the water (do not touch the loop) with the carbon coated Move the grid very slowly laterally, until as much water as possible is eliminated from the surface of the supporting film. If the movement is slow enough, then only a very small droplet of water remains on the grid and this does not present an obstacle for the placement Place the slot grid under the electron microscope and find the cell of interest using the traces of the coordinates on the first few sections. Take consecutive photographs (or grab the images with the computer) from the serial sections until the organelle of interest (observed under the LSCM) is no longer seen (see example in Figure 3D-R). Using software for 3D reconstruction, align the images and then construct a 3D model according to the software instructions (see example in Figure 3D-R). 11 l K L l i j M N In vivo dynamics and ultrastructure of individual carriers using correlative light-electron The Golgi-to-plasma membrane carrier (GPC) in panel (arrow) was picked out in vivousing time-lapse confocal microscopy (see movie 2.1). After fixation, the cells were immunoperoxidase labelled and embedded in (arrow) was identified as the fluorescent GPC shown in by electronic superimposition of the two images in and using the CELLocate co-ordinates (an example of which is shown in ). As can be seen, the general pattern of immunoperoxidase labelling in coincides with the fluorescent pattern of VSVG-GFP in . Serial sections of the cell were then produced ng the transport intermediate (; arrow) was captured at low magnification (). Note that the sections centification; e.g. a protrusion ( represent a series of consecutive 200 nm sections containing the GPC (arrow). The field shown in panels is the area of the cell identified with a white box in . Three-dimensional reconstruction characterizes the GPC as an elonga Critical parameters and troubleshooting. Taken all together, the stages of CVLEM represent quite a long procedure (see below) and require significant effort of a researcher or a technician. It would thus be particularly disappointing to lose tour de force experiments because of small problems in specimen handling. To apply CVLEM meters should always be taken into account by the experimenter. First, preliminary trials should be carried out to determine if the antibodies selected for the labelling of a GFP-fusion protein work with the immuno-EM protocol. Many antibodies that give perfect results with immunofluorescence do not work with immuno-EM staining. This is because the glutaraldehyde used in most EM fixatives tends to cross-link amino groups of antigen epitopes, and therefore to decrease the antigenicity of the target protein. However, a decrease in, or absence of, glutaraldehyde in the fixative can result in the poor preservation of ultrastructure of intracellular organelles. So, if this produces problems with immuno-EM labelling, it is possible to optimize the concentration of glutaraldehyde in the fixative, or to use a periodate-lysine-paraformaldehyde fixative (Brown and Farquhar, 1989). It is also important to use the immunoperoxidase or immunogold protocols for the labelling of a structure of interest. We would advise the immunogold protocol to be used only for the labelling of epitopes of a GFP-fusion protein located in the cytosol (see Strategy section), while for other epSecondly, it is extremely important to be able to find the cell of interest at all the stages of the CVLEM procedure. Thus, only cells located on the grid in the MatTek petri dish can be selected for time-lapse observations. The position of the cell of interest on the grid should be noted, otherwise it will be difficult to find it again. The low magnification images showing the field surrounding the cell of interest can help greatly both in the trimming of the resin block around the correct cells, and in the finding of the cell of interest under EM. In this case, neighbouring cells can be used as landmarks for the identification of the cell of interest. For this reason, the cells for these experiments should be plated at a low confluence (50-60%). During the analysis of the serial sections under EM, it is also useful to have the fluorescence and phase-contrast images of the target cell, as particular structures (e.g. microvilli, pseudopodia, inclusions) can help greatly in the finding of both the cell Thirdly, during the cutting of the specimen, the thickness of the serial sections has to be selected. This should be about 80 nm for routine work, 50 nm (or less) for very precise 3D reconstruction, and 250 nm for EM tomography. The entire CVLEM procedure requires a reasonable time for its completion (4-5 days). During the first day, the cells need to be transfected with the cDNA. The next day, the observations can be made on the living cells, they can be fixed, and the immunolabelling can be started. The third day is required to complete the immunolabelling and resin embedding of the cells. During the fourth day, the cell of interest can be identified in the resin block and cut in serial sections. However, it is also possible to store already embedded speciments for a long time, and hence to cut them later. Brown, W.J. and Farquhar, M.G. 1989. Immunoperoxidase methods for the localization of antigens ections by electron microscopy. Deerinck, T.J. et al. 1994. Fluorescence photooxidation with eosin: a method for high resolution immunolocalization and in situ hybridization detection for light and electron microscopy. J. Burry, R.W., Vandre, D.D. and Hayes, D.M. 1992. Silver enhancement of gold antibody probes in pre-embedding electron microscopic immunocytochemistry. J. Histochem. CytochemMironov, A.A., Polishchuk, R.S. and Luini, A. 2000. Visualising membrane traffic in vivo by combined video fluorescence and 3-D-electron microscopy. ive video/light electron microscopy. Current J. and Yamada, K.M. (eds). John Wiley & Sons, New York. 4.8.1–4.8.9. E.V., Marra, P., Buccione, R., Alberti, S., Luini,A. and Mironov, A.A. 2000. GFP-based correlative light-electron microscopy ar ultrastructure of carriers in transit from the Golgi apparatus to the plasma membrane.resolution of time-lapse imaging. Imag. Microsc. 5: 38-40. Powell, R.D. et al. 1998. Combined fluorescent and gold immunoprobes: reagents and methods for correlative light and electron microscopy. Microsc. Res. Tech.