PDF-Decoding Seismograms.doc 1 Author Paul Denton
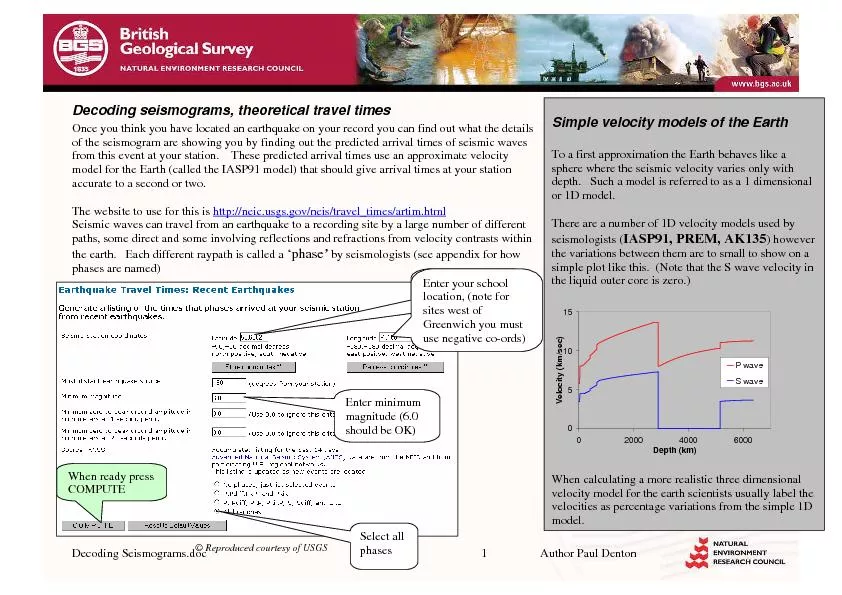
of the seismogram are showing you by finding out the predicted arrival times of seismic waves from this event at your station These predicted arrival times use an
Download Presentation
"Decoding Seismograms.doc 1 Author Paul Denton" is the property of its rightful owner. Permission is granted to download and print materials on this website for personal, non-commercial use only, provided you retain all copyright notices. By downloading content from our website, you accept the terms of this agreement.
Presentation Transcript
Transcript not available.